Bed management systems: occupancy, ward visibility and discharge
A bed management system shows, at any moment, which beds in a hospital are occupied, which are free, which patients are waiting for a bed and which are ready to go home. Its value is not the count itself but what the count allows: admitting emergency patients without delay, planning discharges from the day of admission, and keeping occupancy at a level that is safe for patients and staff.
In many public hospitals the bed state is known only by walking the wards. The night nurse counts, the morning report is compiled by hand, and the emergency department telephones each ward in turn to find space. This guide explains how bed capacity should be measured, what the evidence says about high occupancy, how discharge planning drives flow, and what a hospital should expect from a digital bed management system.
What bed management covers
Bed management is often reduced to a census. In practice it spans four connected activities:
- Knowing the current state. Every bed in every ward, with its status: occupied, free, being cleaned, blocked or reserved.
- Placing patients. Matching admissions from the emergency department, theatres, outpatient clinics and referring facilities to an appropriate bed.
- Moving patients. Recording transfers between wards and levels of care, including requests that await approval.
- Discharging patients. Planning each discharge from admission so that beds are released when patients are ready, not when the paperwork is complete.
A system that handles only the first activity is a display. A bed management system handles all four, and it does so from the same patient record the clinical teams use.
Measuring bed capacity correctly
Bed figures are easy to misread because they are counted in different ways. In Australia, a review of bed statistics found that some hospitals counted only beds they considered funded and others only beds they could fully staff [3]. The Australian Institute of Health and Welfare definition of an available bed, cited in that review, is a bed immediately available to be used by an admitted patient if required, which excludes items such as recovery trolleys, delivery beds and emergency stretchers [3]. Day procedure beds add a further complication, since one bed may treat several patients in a day [3].
International indicators define the terms more tightly:
| Indicator | Definition | Note |
|---|---|---|
| Hospital bed density | Hospital beds per 10,000 population, excluding labour and delivery beds [8] | Disaggregate by region, ownership and bed type [8] |
| Bed occupancy rate | Total bed days in the year divided by available beds multiplied by 365, as a percentage [7] | Definitions vary by country [7] |
| Average length of stay | Mean number of days an admitted patient stays | Should be reported by ward and specialty |
| Patients awaiting a bed | Admitted patients still in the emergency department | The clearest measure of access block |
The WHO European indicator for acute care bed occupancy illustrates how much definitions vary: some countries count day cases as one bed day, one uses 320 days rather than 365 as the denominator, and another includes long term and rehabilitative beds [7]. For a hospital, the practical lesson is that occupancy should be calculated by the system from recorded admissions, transfers and discharges against a defined list of available beds, so that the figure means the same thing every month.
Why high occupancy harms patients
Hospitals are under constant pressure to keep beds full, and a full hospital looks efficient. The evidence suggests it is not safe.
A review in the Medical Journal of Australia summarised the risks [1]. A study in the United Kingdom found a 10.3 percent increase in MRSA infection rates when occupancy exceeded 90 percent, compared with occupancy of 84 percent [1]. Among the 20 largest public hospitals with emergency departments in New South Wales, occupancy was negatively correlated with emergency admission performance [1]. A study of staff across 16 Finnish hospitals found that occupancy above 95 percent was significantly associated with staff starting antidepressant medication, with a hazard ratio of 1.7 [1].
The often quoted target of 85 percent occupancy is itself contested. An accompanying editorial noted that some authors regard it as simplistic, and argued instead for patient outcome measures rather than process targets [2]. The review of bed statistics made a related point: a single overall occupancy rate does not reflect the complexity of a hospital's beds or the management needed to run them efficiently [3].
The resolution is to measure more precisely. A hospital that can see occupancy by ward, by hour and by type of bed can tell the difference between a medical ward that is persistently overfull and a surgical ward with capacity on most afternoons.
Beds and the emergency department
When wards are full, admitted patients wait in the emergency department. This is access block, and it is one of the main drivers of emergency department crowding. A systematic review of crowding found it to be a major patient safety concern associated with poor patient outcomes, including higher mortality during crowded periods and more patients leaving before receiving care [9].
The consequences can extend across a whole referral network. In Ghana, the term "no bed syndrome" came into use after a 70 year old man died in 2018 following failed attempts to secure admission at seven hospitals [10]. Ridge Hospital in Accra had been expanded from 200 to 420 beds in 2017 and still faced a shortage [10]. Additional beds alone did not solve the problem; the system also needed to know where capacity existed.
For the emergency department, the requirement is simple: the team making an admission decision should see which beds are free and which are about to be, without telephoning each ward. Emergency flow is covered in digitising the emergency department.
Discharge planning starts at admission
Beds are released by discharges, so the most effective bed management happens on the wards, not in a control room.
The evidence for structured discharge planning is consistent. A Cochrane review of 33 randomised trials with 12,242 participants found that a discharge plan tailored to the individual patient probably brings about a small reduction in the initial length of hospital stay and a relative reduction in readmission over about three months, with a risk ratio of 0.89 [4]. It found little or no difference in mortality [4].
The National Institute for Health and Care Excellence recommends that a single health or social care practitioner be made responsible for coordinating each person's discharge, that discharge planning for people with complex needs start on admission, and that the discharge plan be given to the person and everyone involved in their ongoing care [6].
Red and green days
The NHS in England uses the concept of red and green bed days to make delay visible on every ward round [5]. A green day is one in which the patient receives care that can only be delivered in an acute hospital bed; a red day is one in which the patient receives little or no value adding acute care [5]. The approach asks that every patient know four things: what is wrong with them, what is happening next, the clinical criteria for their discharge and their expected date of discharge [5].
A digital system supports this by recording an expected date of discharge and clinical criteria against the admission, showing them on the ward view, and flagging patients whose expected date has passed.
What live ward visibility requires
The functions below distinguish a working bed management system from a spreadsheet of bed numbers.
| Function | What it provides |
|---|---|
| Live census by ward and bed | Occupied, free, cleaning and blocked beds, updated as staff admit, transfer and discharge |
| Admission from any entry point | Emergency, outpatient, theatre and referral admissions placed against a bed |
| Transfer requests | Ward to ward and level of care transfers requested, approved and recorded |
| Expected date of discharge | Recorded at admission, visible on the ward, flagged when passed |
| Discharge summary | Written in the record, with follow up instructions and medicines |
| Executive dashboard | Census across the hospital, inpatient counts and intensive care status |
| Reporting | Occupancy and length of stay calculated from recorded events |
The census should never be typed in. If it is calculated from admissions, transfers and discharges recorded in the course of care, it is always current and always consistent with the clinical record.
Matching the system to the facility
Not every facility has inpatient beds. A clinic that sees outpatients only should not see ward and bed features at all, while a clinic that offers maternity care may need a small number of beds and a newborn pathway. A hospital information system should adapt to the facility rather than present every user with hospital functions. Scaling these choices across many facilities is discussed in scalable health information systems for small island states.
How Moana approaches this
In Moana, bed management is part of hospital operations and runs on the same patient record as clinical care. Beds and wards are configured for each facility, and the census is calculated from the admissions, transfers and discharges that clinical staff record as they work.
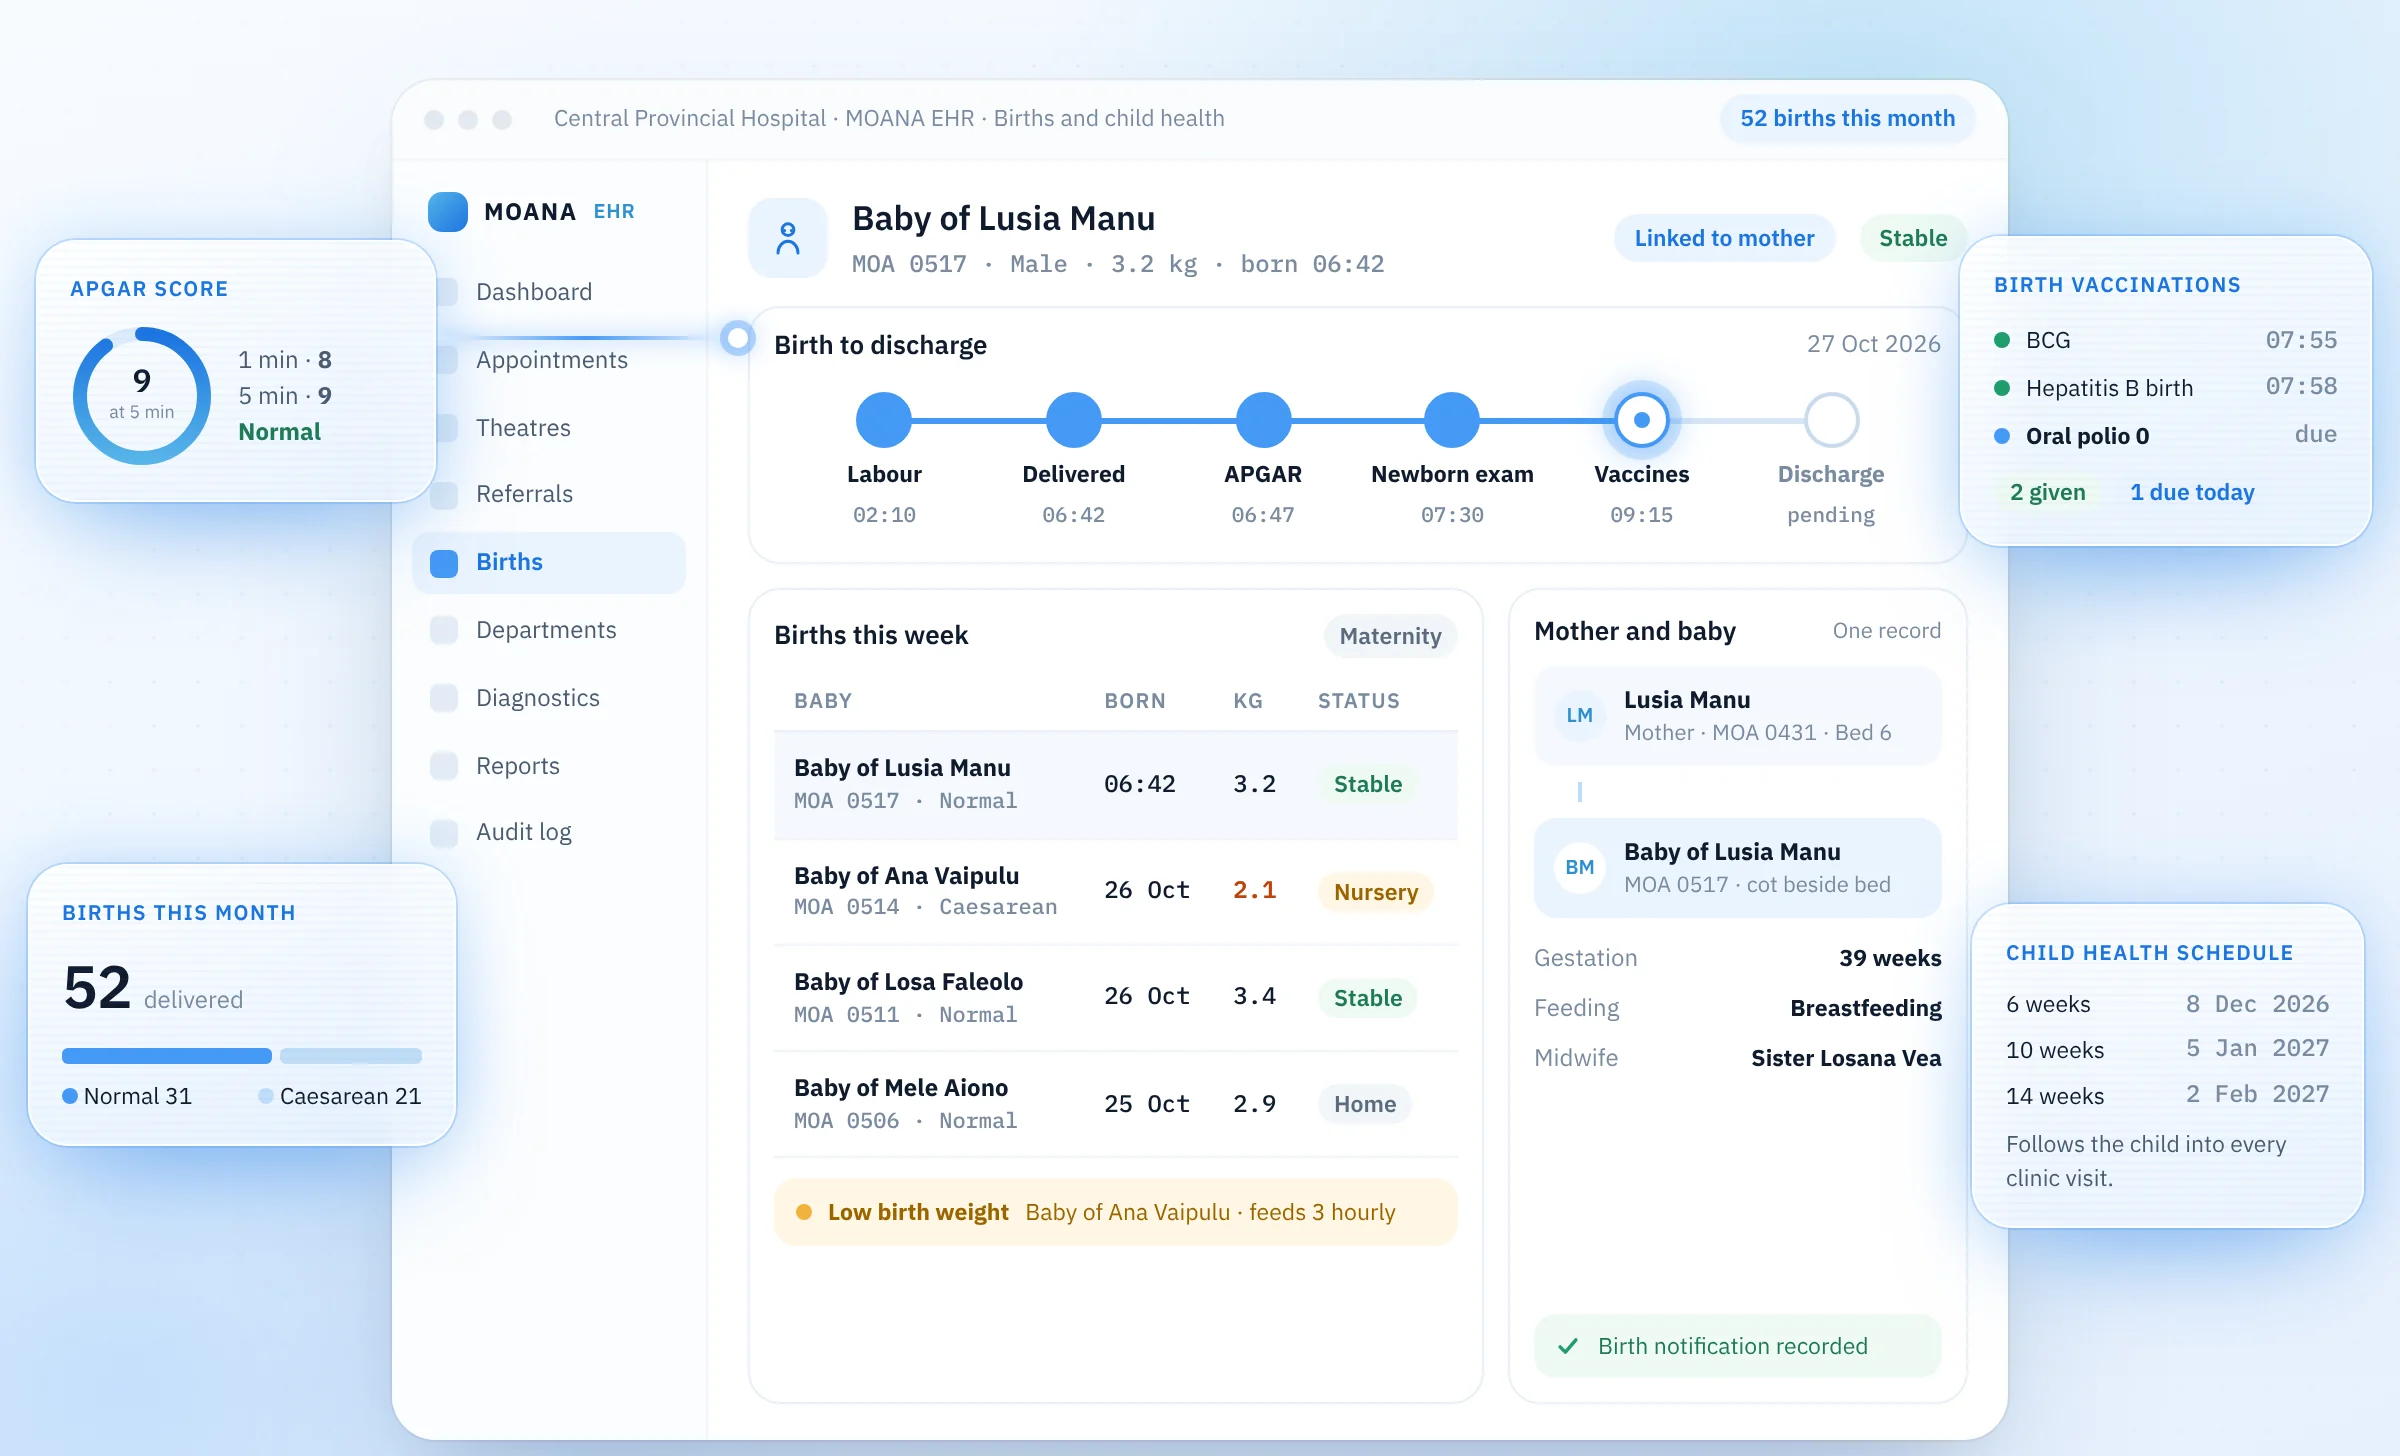
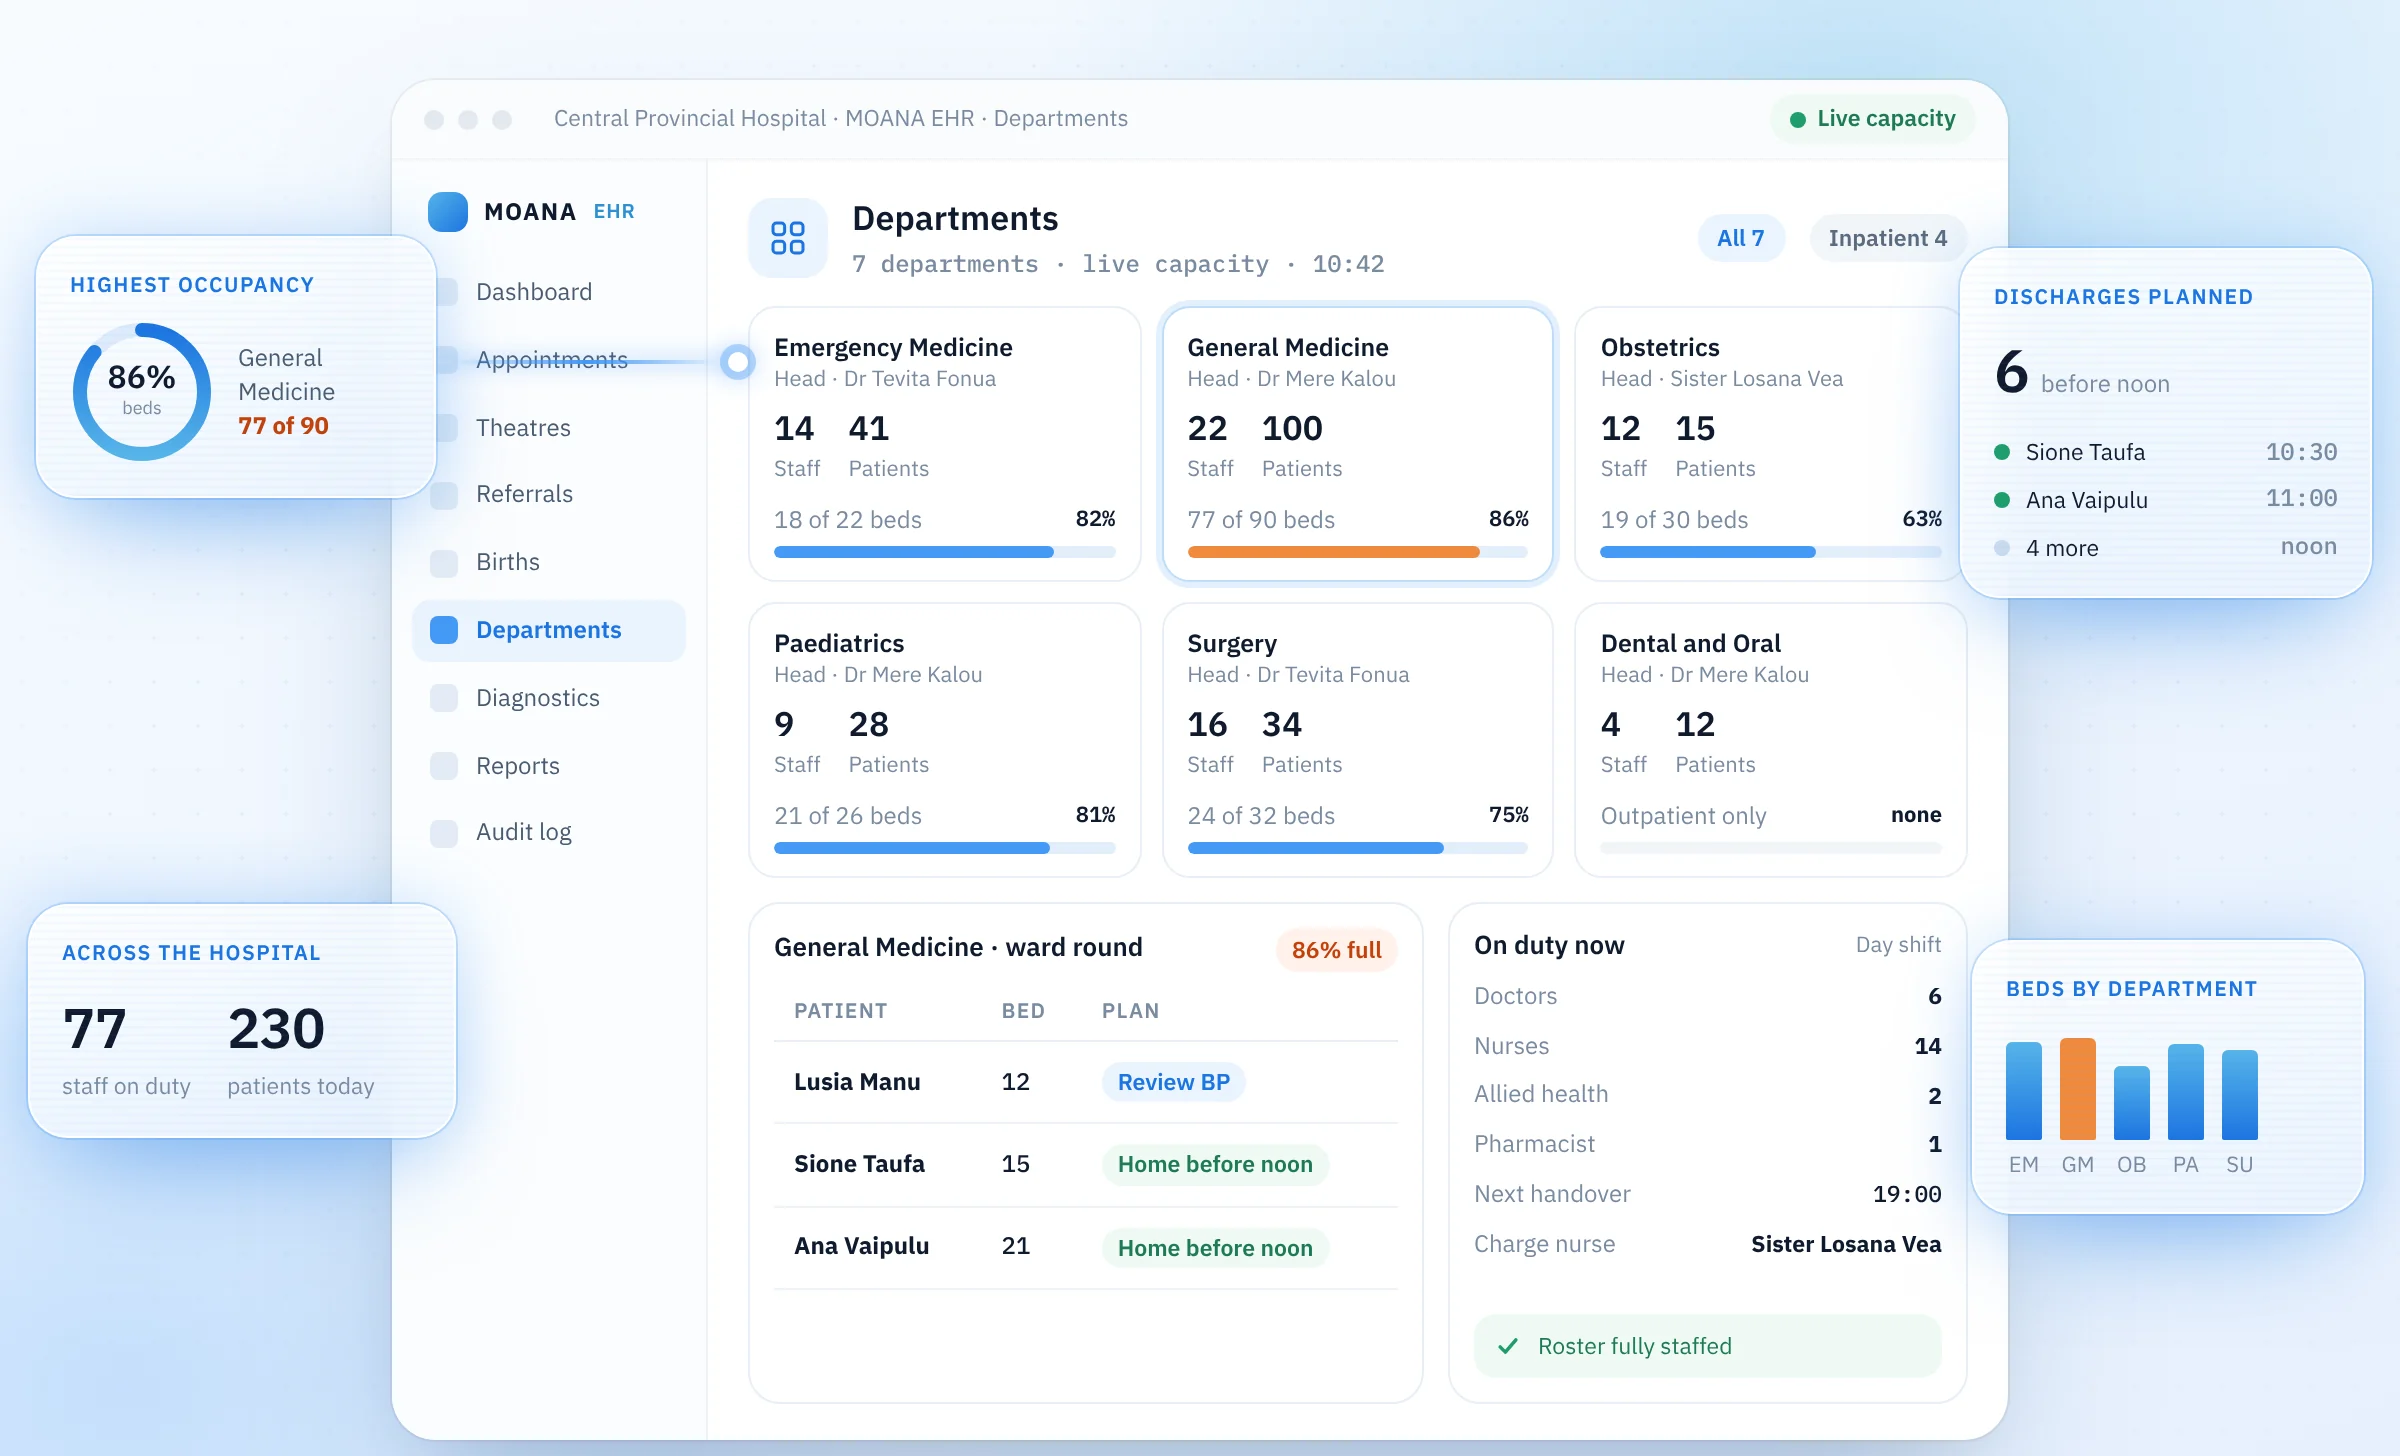
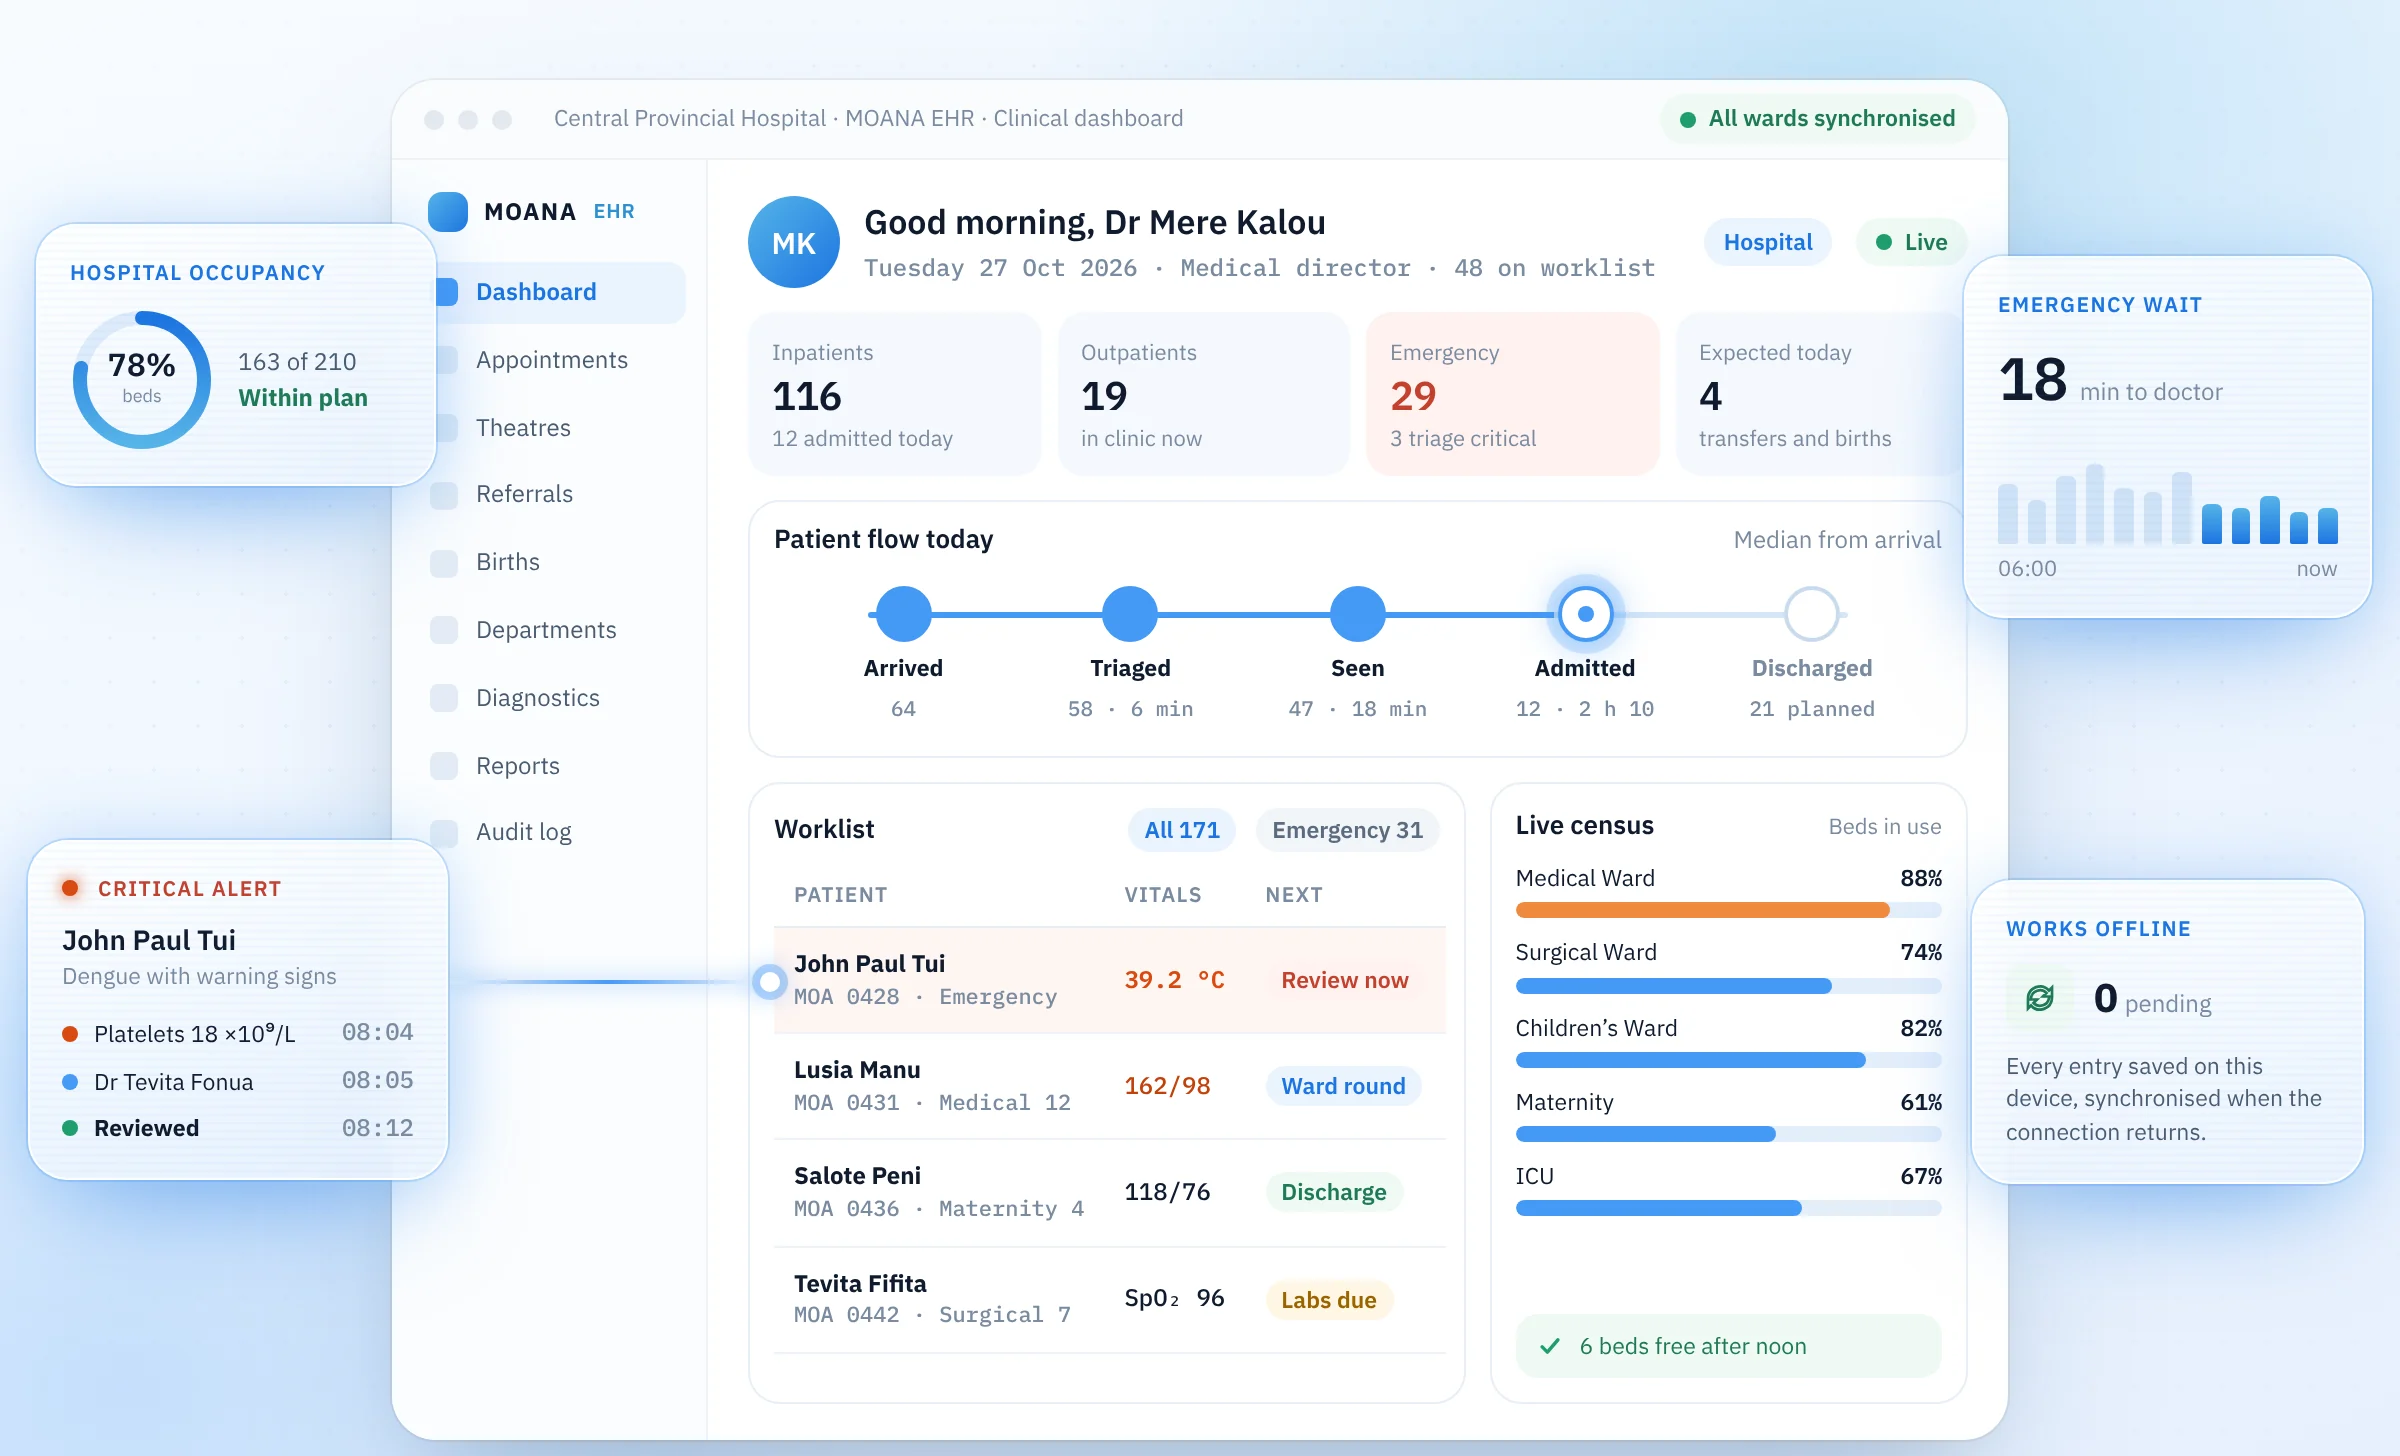
The hospital dashboard shows a live hospital census, with inpatient, outpatient and emergency counts, bed occupancy by ward and intensive care status. Ward teams see their own beds and patients. A doctor can request a ward transfer from the patient's record, and the request is recorded and acted on through the same system. Patients can be transferred from outpatient to inpatient care where the facility provides inpatient services, and discharge is recorded with a summary and follow up instructions in the electronic health record.
Facility type and service level determine what each facility sees. A clinic without inpatient services does not see beds, wards or inpatient census; a clinic that turns on birth management gains the inpatient and maternal and child features it needs. A provincial hospital sees the full set.
Bed and ward visibility across the hospital was one of the areas mapped with clinical teams at ANGAU Memorial Provincial Hospital in Lae, Papua New Guinea, where every department has been mapped and configured in Moana with its Officer in Charge and go live is expected in the coming weeks. The approach is described in the ANGAU case study.
Moana is designed for unreliable connectivity. An admission or discharge recorded during an outage is saved on the device and synchronised when the connection returns, so the census catches up without anyone retyping it. Every change is attributed in the audit log.
Key questions for procurement
Is the census calculated or entered?
It should be calculated from recorded admissions, transfers and discharges. A census that relies on manual entry will diverge from the clinical record.
Can the emergency department see bed availability?
Access block is a major driver of crowding [9]. The admitting team should see free beds and pending discharges directly.
How is occupancy defined?
Ask how available beds are defined and how day cases are counted, since definitions vary between systems and countries [7].
Does the system support discharge planning from admission?
Look for an expected date of discharge, clinical criteria for discharge and a discharge summary recorded in the patient record, in line with guidance that planning begin on admission [6].
Can features be matched to facilities without inpatient beds?
Clinics and small facilities should not have to work around hospital features they do not use.
Sources
- Hospital bed occupancy: more than queuing for a bed, Medical Journal of Australia, 2010
- Hospital capacity: what is the measure and what is the goal?, Medical Journal of Australia, 2010
- Hospital beds: a primer for counting and comparing, Medical Journal of Australia, 2010
- Discharge planning from hospital, Cochrane, 2022
- Red and green bed days, NHS England, 2016
- Transition between inpatient hospital settings and community or care home settings for adults with social care needs: recommendations, National Institute for Health and Care Excellence, 2015
- Bed occupancy rate, acute care hospitals only, WHO Regional Office for Europe, accessed 2026
- Hospital bed density, MEASURE Evaluation, accessed 2026
- The relationship between emergency department crowding and patient outcomes: a systematic review, Journal of Nursing Scholarship, 2014
- No bed syndrome, Reach Alliance, 2024