Medicine Supply Chain Visibility: From Warehouse to Health Facility
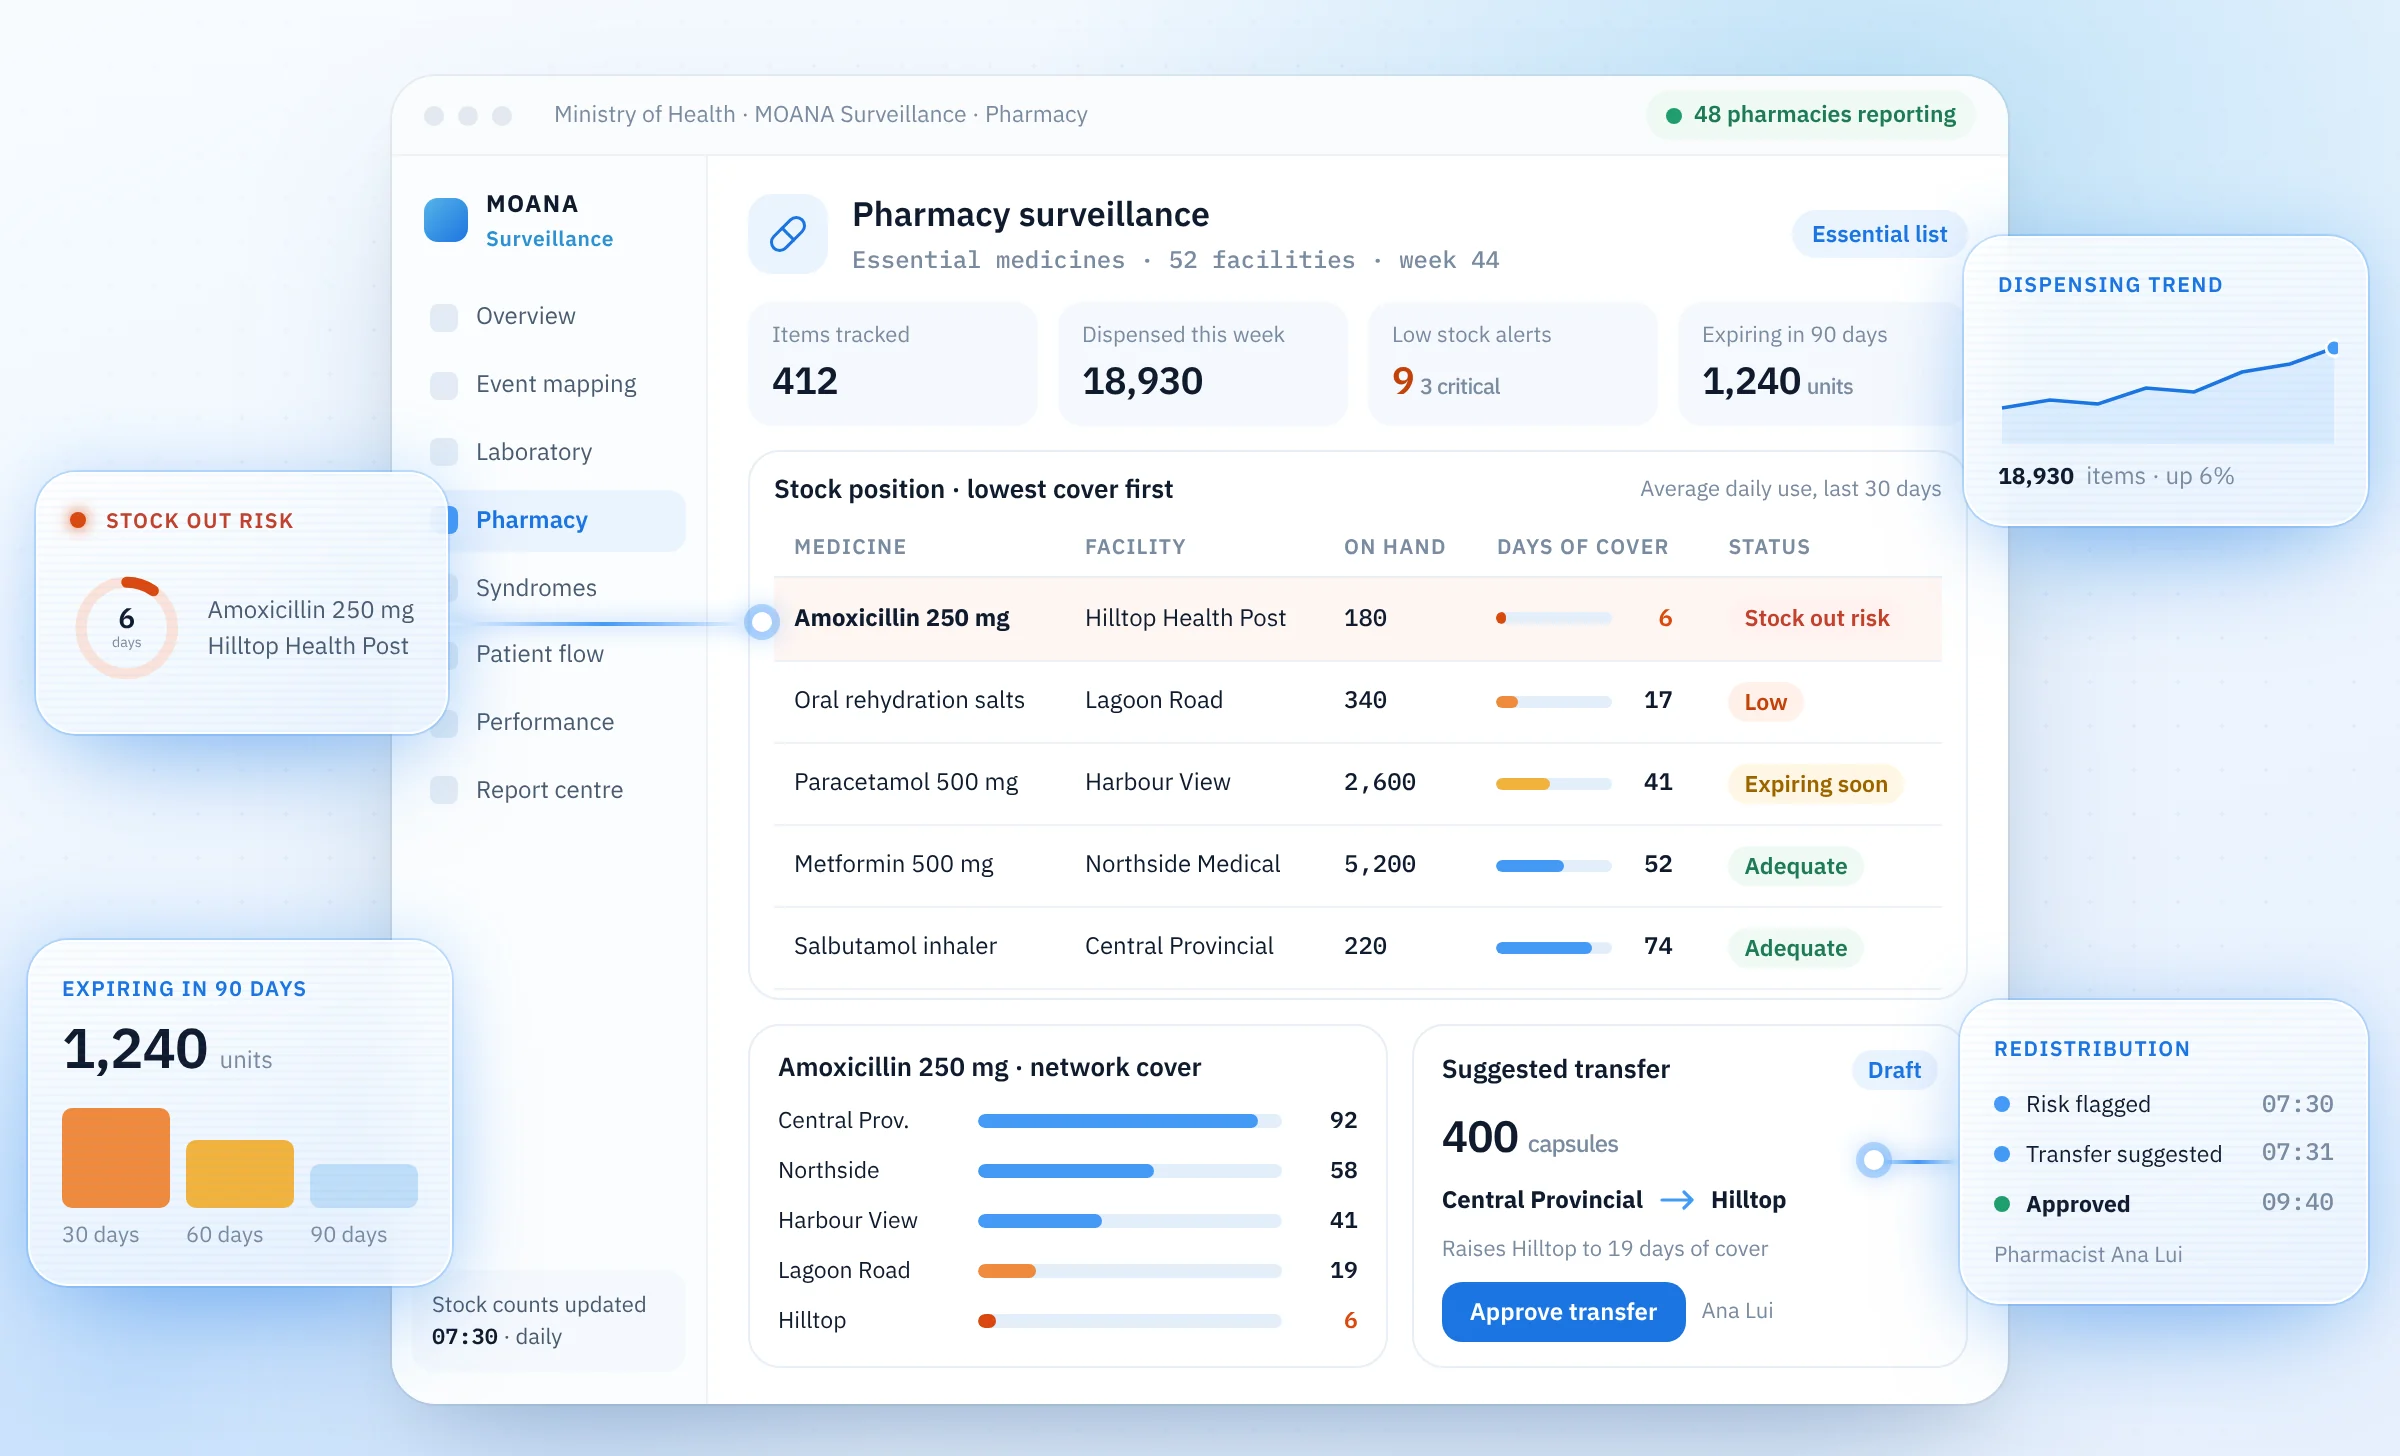
Supply chain visibility means that every level of a health system can see how much of each medicine is on hand, how much was used and what is on its way, from the central medical store to the shelf in each facility. Without it, facilities run out while stock sits in a warehouse. The foundation is a logistics management information system that records stock on hand, consumption, and losses and adjustments at every level, and visibility only improves outcomes when those data reach the people who decide what to order and where to send it.
Medicines are the most visible test of whether a health system works. A patient who is diagnosed correctly and then sent home without treatment has received half a service. WHO and Health Action International surveys across 36 countries, published in The Lancet, found that public sector availability of selected generic medicines averaged only 38% [1]. The Sustainable Development Goals now track the problem directly: indicator 3.b.3 measures the proportion of health facilities where at least 80% of a core set of 32 tracer essential medicines is available and affordable on the day of a visit [2].
This guide explains why stockouts persist, what visibility requires at each level of the chain, what the evidence says about electronic logistics systems, and what a ministry should ask before procuring one.
Why stockouts persist
Stockouts are rarely caused by a single failure. Funding arrives late, orders are calculated from incomplete data, transport is irregular and records at the facility do not match what is on the shelf. A 2025 survey of 172 health workers and stakeholders in Manus Province, Papua New Guinea, illustrates the pattern: 22.7% reported that essential medicines ran out about monthly, 14.5% that medicines were always or constantly out of stock, and only 1.7% that they had never experienced a shortage [9]. Respondents most often named delayed government funding as a cause, alongside weak links between stock monitoring and timely financing, freight costs and limited facility autonomy [9].
The most telling failure is the one where the medicine exists but is in the wrong place. The Global Fund's Office of the Inspector General, auditing in country data systems in 2023, reported recurring stockouts of HIV, tuberculosis and malaria commodities at health facilities in the Republic of Congo even when stock was available centrally [7]. Twelve OIG country audits since 2018 had reported supply data issues with resulting stockouts and expiries [7]. That is a visibility problem, not a procurement problem: the system bought enough, but no one could see where it was needed in time to move it.
What visibility means at each level
A public supply chain typically runs from a central medical store through regional or provincial stores and district depots to hospitals, health centres and aid posts, and finally to the dispensing point and the patient. Each level needs to see something different.
| Level | What it needs to see | Decisions it makes |
|---|---|---|
| National or central store | Stock on hand nationally, consumption trends, pipeline and expiry by batch | Quantification, procurement, allocation between regions |
| Provincial or regional store | Stock and consumption at each district and facility below it | Resupply schedules, redistribution between facilities |
| District | Facility stock, reporting completeness, pending requisitions | Approving orders, supervising facilities, emergency transfers |
| Hospital or health centre | Own stock by item, batch and expiry, ward and dispensing consumption | Requisitions, ward supply, stock rotation |
| Dispensing point | What is available now, and what the patient was given | Dispensing, substitution, referral when out of stock |
The USAID | DELIVER Logistics Handbook notes that decisions about how much facility data to aggregate depend on how visible facility level data must be higher in the system [3]. In practice, a ministry that wants to redistribute stock between facilities needs facility level data, not a district total.
The data a logistics system must record
The Logistics Handbook defines an LMIS as the records and reports used to collect, organise and present logistics data from across the system, so that managers have the data they need to improve service to clients [3]. It identifies three essential data items [3]:
- Stock on hand: the quantity of usable stock available. Unusable stock is counted as a loss, not as stock on hand.
- Consumption: the quantity dispensed to users or used during a set period.
- Losses and adjustments: losses are stock removed for reasons other than use by clients, such as expiry or theft; adjustments are transfers between facilities at the same level or corrections to records.
These are captured in three kinds of record: stockkeeping records such as bin cards and inventory control cards, transaction records that prove a requisition, issue or delivery, and consumption records [3]. The handbook is blunt about scope: "If you are not going to use information and data to make decisions, do not collect it in the LMIS" [3].
Pull and push
The handbook distinguishes a requisition system, where the facility receiving supplies calculates what it needs, from an allocation system, where the issuing level calculates what to send [3]. Many national programmes use both, for example requisition for hospitals and allocation for small health posts. A supply system must therefore be configurable to the ordering pattern of each level rather than impose one model.
Reporting that facilities want to send
Reporting rates often improve when a summary report is tied to a resupply order, because facilities are more likely to report when they receive something in return [3]. The same principle applies to electronic systems: if the requisition is the report, completeness follows the order cycle.
What the evidence says about electronic systems
Computerisation helps, but it is not sufficient on its own. Two evaluations from Tanzania show both sides.
After Tanzania introduced a national electronic LMIS and a Logistics Management Unit to analyse its data, the average stockout rate across product groups fell from 32% to 23%, and stockouts lasting more than seven days fell from 24% to 15%, between 2013 and 2015 [6]. Annual supply chain costs rose from US$66 million to US$76 million, but cost relative to the value of commodities, adjusted for performance, fell from 58% to 50% [6]. The authors' conclusion is the one ministries should remember: technology driven data visibility alone is insufficient; the data must be analysed and used for decisions [6].
In Arusha, Kilimanjaro and Tanga, Tanzania, an integrated electronic immunisation registry and logistics system was rolled out to 924 health facilities. In the analysed sample, the monthly average vaccine stockout rate fell from 7.1% to 2.1%, and the odds of a stockout fell about 4.1% for each week a facility used the system [5]. The authors attribute part of the effect to shared visibility: supervisors could access the same data as the health worker, and district staff could see frontline stock without waiting for monthly reports when the network was available [5]. They also note that the sample was selected for complete data and likely over represents stronger facilities [5].
USAID's guidelines for computerising an LMIS reach the same conclusion from the implementation side. They advise confirming that computerisation is warranted, involving users from the start, testing with real data, and training two audiences: the operators who enter data and the decision makers who use reports to decide procurement and stock movements. Training only operators is identified as a common weakness [4].
Fragmentation and data quality
The Global Fund OIG found that logistics information systems in the countries it audited were fragmented, with multiple standalone electronic and manual systems across levels of the supply chain [7]. Five of eight sampled countries had no aggregate consumption data for health products in a centralised LMIS, six of eight had no routine reconciliation process, and consumption data were rarely triangulated with patient data [7].
The last point matters most for system design. When consumption is reported separately from dispensing, two records describe the same event and drift apart. When consumption is derived from what was actually dispensed to patients, the logistics figure and the clinical figure are the same number. That is the case for linking the supply chain to the pharmacy and to the patient record, rather than running it as a parallel reporting exercise. The guide on traceable national health reporting applies the same principle to health statistics.
Batch, expiry and product quality
Visibility is also a safety function. WHO estimates that about one in ten medical products in low and middle income countries is substandard or falsified, with a 10.5% failure rate in the studies it reviewed, and it had received 1,500 reports of such products since 2013, most often antimalarials and antibiotics [8]. WHO notes that substandard products reach patients where the capacity to enforce quality standards in supply and distribution is limited [8].
A supply system that records batch numbers and expiry dates on receipt, issue and dispensing allows a recall to be traced to the facilities and, where dispensing is recorded, to the patients who received an affected batch. It also supports first expiry, first out rotation and makes expiry losses visible early enough to redistribute stock rather than destroy it. The pharmacy side of this is covered in the guide on pharmacy management systems and medication safety.
People, governance and the visibility network
Software does not move medicines. People that Deliver, the global initiative on the health supply chain workforce, has argued for professionalisation so that supply chain workers are "a recognised cadre within the health system", and for organisational policies, staffing and human resource systems that plan and retain them [10]. A 2025 supplement of Global Health: Science and Practice was devoted to the supply chain workforce in low and middle income countries, including leadership programmes and career paths [11].
The visibility and analytics network concept draws on lessons from private sector supply chains; JSI and the Bill & Melinda Gates Foundation jointly led a 2018 workshop on how such networks were being implemented in Francophone West and Central Africa [12]. JSI's related IMPACT Team approach, implemented in seven countries, has teams at different levels of the health system set targets, choose metrics and use data to monitor and correct performance [12]. For a ministry, the lesson is that visibility needs an owner at each level, with a routine for reviewing the numbers and acting on them.
Indicators worth monitoring
| Indicator | What it shows |
|---|---|
| Percentage of facilities with a stockout of each tracer item | Availability as the patient experiences it |
| Stockout duration | Whether shortages are corrected quickly or become chronic |
| Percentage of expected reports or requisitions received on time | Completeness and timeliness of the data |
| Order fill rate | Whether the supplying level can meet what was requested |
| Stock held above maximum or below minimum | Whether ordering rules are being followed |
| Value of expired stock | Losses from poor rotation or overstocking |
| Reconciliation between dispensed and issued quantities | Data quality and leakage |
| Requisition to delivery lead time | Performance of distribution |
The Logistics Handbook recommends feedback reports that show the percentage of facilities experiencing a stockout and the percentage of expected reports received at each level [3]. Every indicator in this table should be calculated by the system from transactions, not compiled by hand.
How the Moana Medical Supply System approaches this
The Moana Medical Supply System manages stock from the warehouse to the facility: receipts into central and provincial stores, requisitions from facilities, approvals, issues, deliveries and receipt at the facility, with stock on hand, losses and adjustments recorded at every level. It is configurable to each supply chain, so the number of levels, the products and units, the ordering pattern of each level and the review periods follow the health authority's own system rather than a fixed model.
Consumption comes from dispensing. In facilities using the Moana Pharmacy Management System, what the pharmacy dispenses to patients is the consumption figure, so requisitions reflect actual use and the logistics record and the clinical record describe the same event. The pharmacy records batch and expiry, manages ward supply and supports recalls, which gives the supply chain traceability down to the dispensing point.
Visibility follows role. A facility sees its own stock and requisitions; district, provincial and national users see the facilities below them, including stock positions, pending orders and deliveries in transit, through the national systems layer. Role based access, two factor authentication and an audit log record who requested, approved, issued and received each consignment. The organisation that collects the data owns it.
The Medical Supply System reconciles with finance systems, so that what was ordered, delivered and paid for can be matched without a separate spreadsheet. It is designed for unreliable connectivity: work in a store or facility is saved on the device and synchronised when the connection returns, and it performs equally on stable networks. The principles behind that design are set out in the guide on designing health systems for unreliable connectivity.
At ANGAU Memorial Provincial Hospital in Lae, Papua New Guinea, the regional referral hospital for the Momase region, every department, including the pharmacy, has been mapped and configured in Moana with its Officer in Charge, and go live is expected in the coming weeks. The governments solution describes how Moana works with health authorities to configure the system to their supply chain.
Key questions for procurement
Does the system record the three essential data items at every level?
It should record stock on hand, consumption, and losses and adjustments for every product at every level, with stockkeeping, transaction and consumption records behind each figure, as the Logistics Handbook sets out [3].
Where does consumption data come from?
Ask whether consumption is entered as a separate report or derived from dispensing. Derived consumption removes a reconciliation problem the Global Fund OIG found in most of the countries it sampled [7].
Can a recall be traced to facilities and patients?
Batch and expiry should be captured at receipt, issue and dispensing, so a recall notice can identify where an affected batch went.
What happens when the network fails?
Store and facility staff must be able to receive, issue and count stock without a connection, with records synchronised later without loss or duplication.
Who will use the data, and how?
Evidence from Tanzania shows that visibility alone is not enough [6]. The vendor's plan should include training for decision makers, not only for data entry staff [4], and a routine for reviewing indicators at each level.
Sources
- Essential medicines out of reach for most people, World Health Organization, 2008
- SDG indicator 3.b.3 metadata: proportion of health facilities that have a core set of relevant essential medicines available and affordable, United Nations Statistics Division and World Health Organization, accessed 2026
- The Logistics Handbook: A Practical Guide for the Supply Chain Management of Health Commodities, USAID DELIVER Project, 2011
- Guidelines for Implementing Computerized Logistics Management Information Systems, Second Edition, USAID DELIVER Project, 2006
- The impact of an integrated electronic immunization registry and logistics management information system on vaccine availability in three regions in Tanzania, Vaccine, 2020
- Better data visibility and data use result in lower cost and improved performance in medicine supply chains, Bloomberg Data for Good Exchange, 2016
- Global Fund audit of in country data and data systems, The Global Fund Office of the Inspector General, 2023
- 1 in 10 medical products in developing countries is substandard or falsified, World Health Organization, 2017
- Budget delays can kill: medicine shortages in PNG health facilities, Devpolicy Blog, Development Policy Centre, 2026
- Advocacy, People that Deliver, accessed 2026
- Supplement on the health supply chain workforce, Global Health: Science and Practice, 2025
- The value of VAN: how visibility and analytics networks make supply chains stronger, JSI, 2018