Traceable national health reporting: from encounters to HMIS
Traceable national health reporting means that every figure in a national return can be followed back to the encounters, results and dispensing events that produced it. When monthly HMIS returns are generated from the clinical record rather than tallied from registers, a district officer or auditor can open any number and see the records behind it, and the data quality checks that WHO normally carries out through field recounts can be run continuously [1].
This guide explains what traceability means in practice, what the evidence says about the accuracy of tallied returns, how WHO assesses routine data quality, and how ministries can move to returns computed from encounters.
What traceability means
A traceable figure has a lineage. The number of first antenatal visits reported by a district for March is the sum of facility figures; each facility figure is a count of encounters that meet a definition; each encounter belongs to a patient, a clinician, a facility and a date.
In a paper system that lineage breaks at every transcription. The patient's visit is written in a register, counted onto a tally sheet, copied onto a monthly form and keyed into the national HMIS at district level. By the time a figure reaches the ministry, nobody can say which patients it represents.
The Health Metrics Network framework treats individual patient records as an institution based data source for the national system [9]. Standards now exist to preserve the lineage from those records to national figures. The HL7 FHIR MeasureReport resource can represent a measure at three levels: an individual patient, a list of the patients who meet the criteria, and a summary count for each population [8]. A national figure published as a summary, with the patient list level held at the facility under access control, is traceable by design.
What the evidence says about tallied returns
Routine health data in many systems is more accurate for some indicators than others, and the pattern is consistent: simple events are counted well, while indicators that require judgement or several steps of tallying drift.
A 2020 study in PLoS ONE compared HMIS reports with facility registers for 14 maternal and newborn indicators across 76 facilities in four districts of Rwanda [2]:
| Indicator | Facilities with acceptable agreement [2] |
|---|---|
| Number of deliveries | 98.7% (75 of 76) |
| First antenatal care, new registrants | 95.7% (66 of 69) |
| Live births | 94.7% (72 of 76) |
| Newborns receiving postnatal care within 24 hours | 81.5% (53 of 65) |
| Women tested for syphilis at first antenatal visit | 67.6% (45 of 68) |
| First antenatal visit meeting the standard | 25.0% (17 of 68) |
| Fourth antenatal visit meeting the standard | 17.4% (12 of 69) |
The same study found that 76.8% of facilities over reported fourth antenatal visits meeting the standard [2]. These are among the indicators most used to judge maternal health programmes.
A before and after study of 492 primary health facilities in Gombe State, Nigeria, published in BMJ Open in 2020, showed what focused effort on data quality can achieve, and its limits [3]. Over the intervention period:
- Availability of monthly reports rose from 72% to 82%.
- Timeliness rose from 60% to 72%.
- Full completeness of 14 maternal and newborn data elements rose from 62% to 68%.
- Agreement between paper registers and DHIS2 for syphilis testing rose from an intraclass correlation of 0.08 to 0.59.
The gains were real, but after nearly two years of work roughly a third of reports were still not fully complete [3]. That pattern is consistent with a constraint in the transcription chain itself.
Regional assessments point the same way. In WHO's 2026 report on SCORE assessments across 19 Western Pacific countries, over half showed lower maturity in routine health service and resource systems [10].
Why tallied reports drift
The burden of paper reporting is large enough to explain most of the drift. A 2021 study of primary care in Cambodia, Ghana, Mozambique, Nigeria and Tanzania found an average of 35 monthly reporting forms per country, one main outpatient form with 4,632 cells, and about nine hours of reporting per health worker each month [4]. Pacific health leaders have described the same paper burden falling on nurses [11].
Drift enters at predictable points:
- Recording. A service is delivered but not written in the register.
- Tallying. A register line is counted under the wrong indicator or not at all.
- Definition. Staff interpret "fourth visit meeting the standard" differently from the national definition.
- Transcription. The monthly form is copied or keyed with an error.
- Timing. Late reports are entered after the period closes, or not at all.
Computed reporting removes steps two, four and much of five, and turns step three into a single definition maintained centrally. Step one remains, and becomes the main quality question.
How WHO assesses routine data quality
WHO's Data Quality Review toolkit sets out four dimensions of routine data quality [1]. Each changes when returns are computed from encounters.
| Dimension [1] | In a tallied system | In a computed system |
|---|---|---|
| Completeness and timeliness | Whether facilities submit forms, and on time | Whether facilities are recording and synchronising, visible daily |
| Internal consistency | Outliers, trends and agreement between indicators, checked after submission | Checked as data arrives, with each outlier traceable to its records |
| External comparison | HMIS against surveys or pharmacy records | HMIS against surveys, with laboratory and pharmacy data on the same platform |
| Consistency of population data | Denominators from census projections | Unchanged; denominators still come from population sources |
The toolkit's site verification method recounts events from source documents and divides by the reported value. A verification factor below 0.90 indicates over reporting of more than 10%; above 1.10 indicates under reporting of more than 10% [1]. In a computed system the recount and the report are the same query on the same data, so the verification factor measures something more useful: how much care is still being recorded on paper rather than in the system.
Generating national returns from encounters
A computed return depends on four things being in place.
A national data dictionary
Each indicator needs a definition expressed against coded data: which diagnosis codes, which laboratory tests, which age bands, which visit types. WHO SMART guidelines support this by packaging indicator definitions with the clinical workflows that generate the data, so that indicators can be calculated consistently across geographies [12].
A shared facility and patient identity
Counts must aggregate to the same districts and avoid counting a patient twice. This depends on an authoritative facility list and a master patient index, covered in master patient index and unique health identifiers.
A standard route to the HMIS
The IHE Aggregate Data Exchange profile defines how routine aggregate reports move from facilities to districts and onward, with each data point a combination of data element, period and location; its documented example is a facility EMR generating monthly reports for a national HMIS [7]. DHIS2, the national HMIS in more than 70 countries [5], can also aggregate individual level records into routine reports without entering the same data twice [6].
Period control and revision
Reports need a rule for late data. A facility that synchronises after a connectivity outage will add encounters to a closed period. The return should record the revision, show what changed and why, and keep the earlier version for audit.
What auditors, donors and ministries ask for
| Question | What a traceable system provides |
|---|---|
| Where does this figure come from? | The list of encounters behind it, available to authorised roles |
| Who changed the data, and when? | An audit log of every change to the underlying records |
| Which facilities have not reported? | Reporting compliance and data freshness by facility |
| Is the definition the same everywhere? | One central indicator definition, versioned |
| Can the ministry rerun last year's report? | Stored report versions and the definitions used at the time |
| Is patient identity protected? | Aggregates for national use; identified lists restricted by role, as described in health data security and privacy |
The wider architecture this sits in is set out in building a national health information system on routine care, and the same data supports disease surveillance from the clinical record.
How Moana makes national reporting traceable
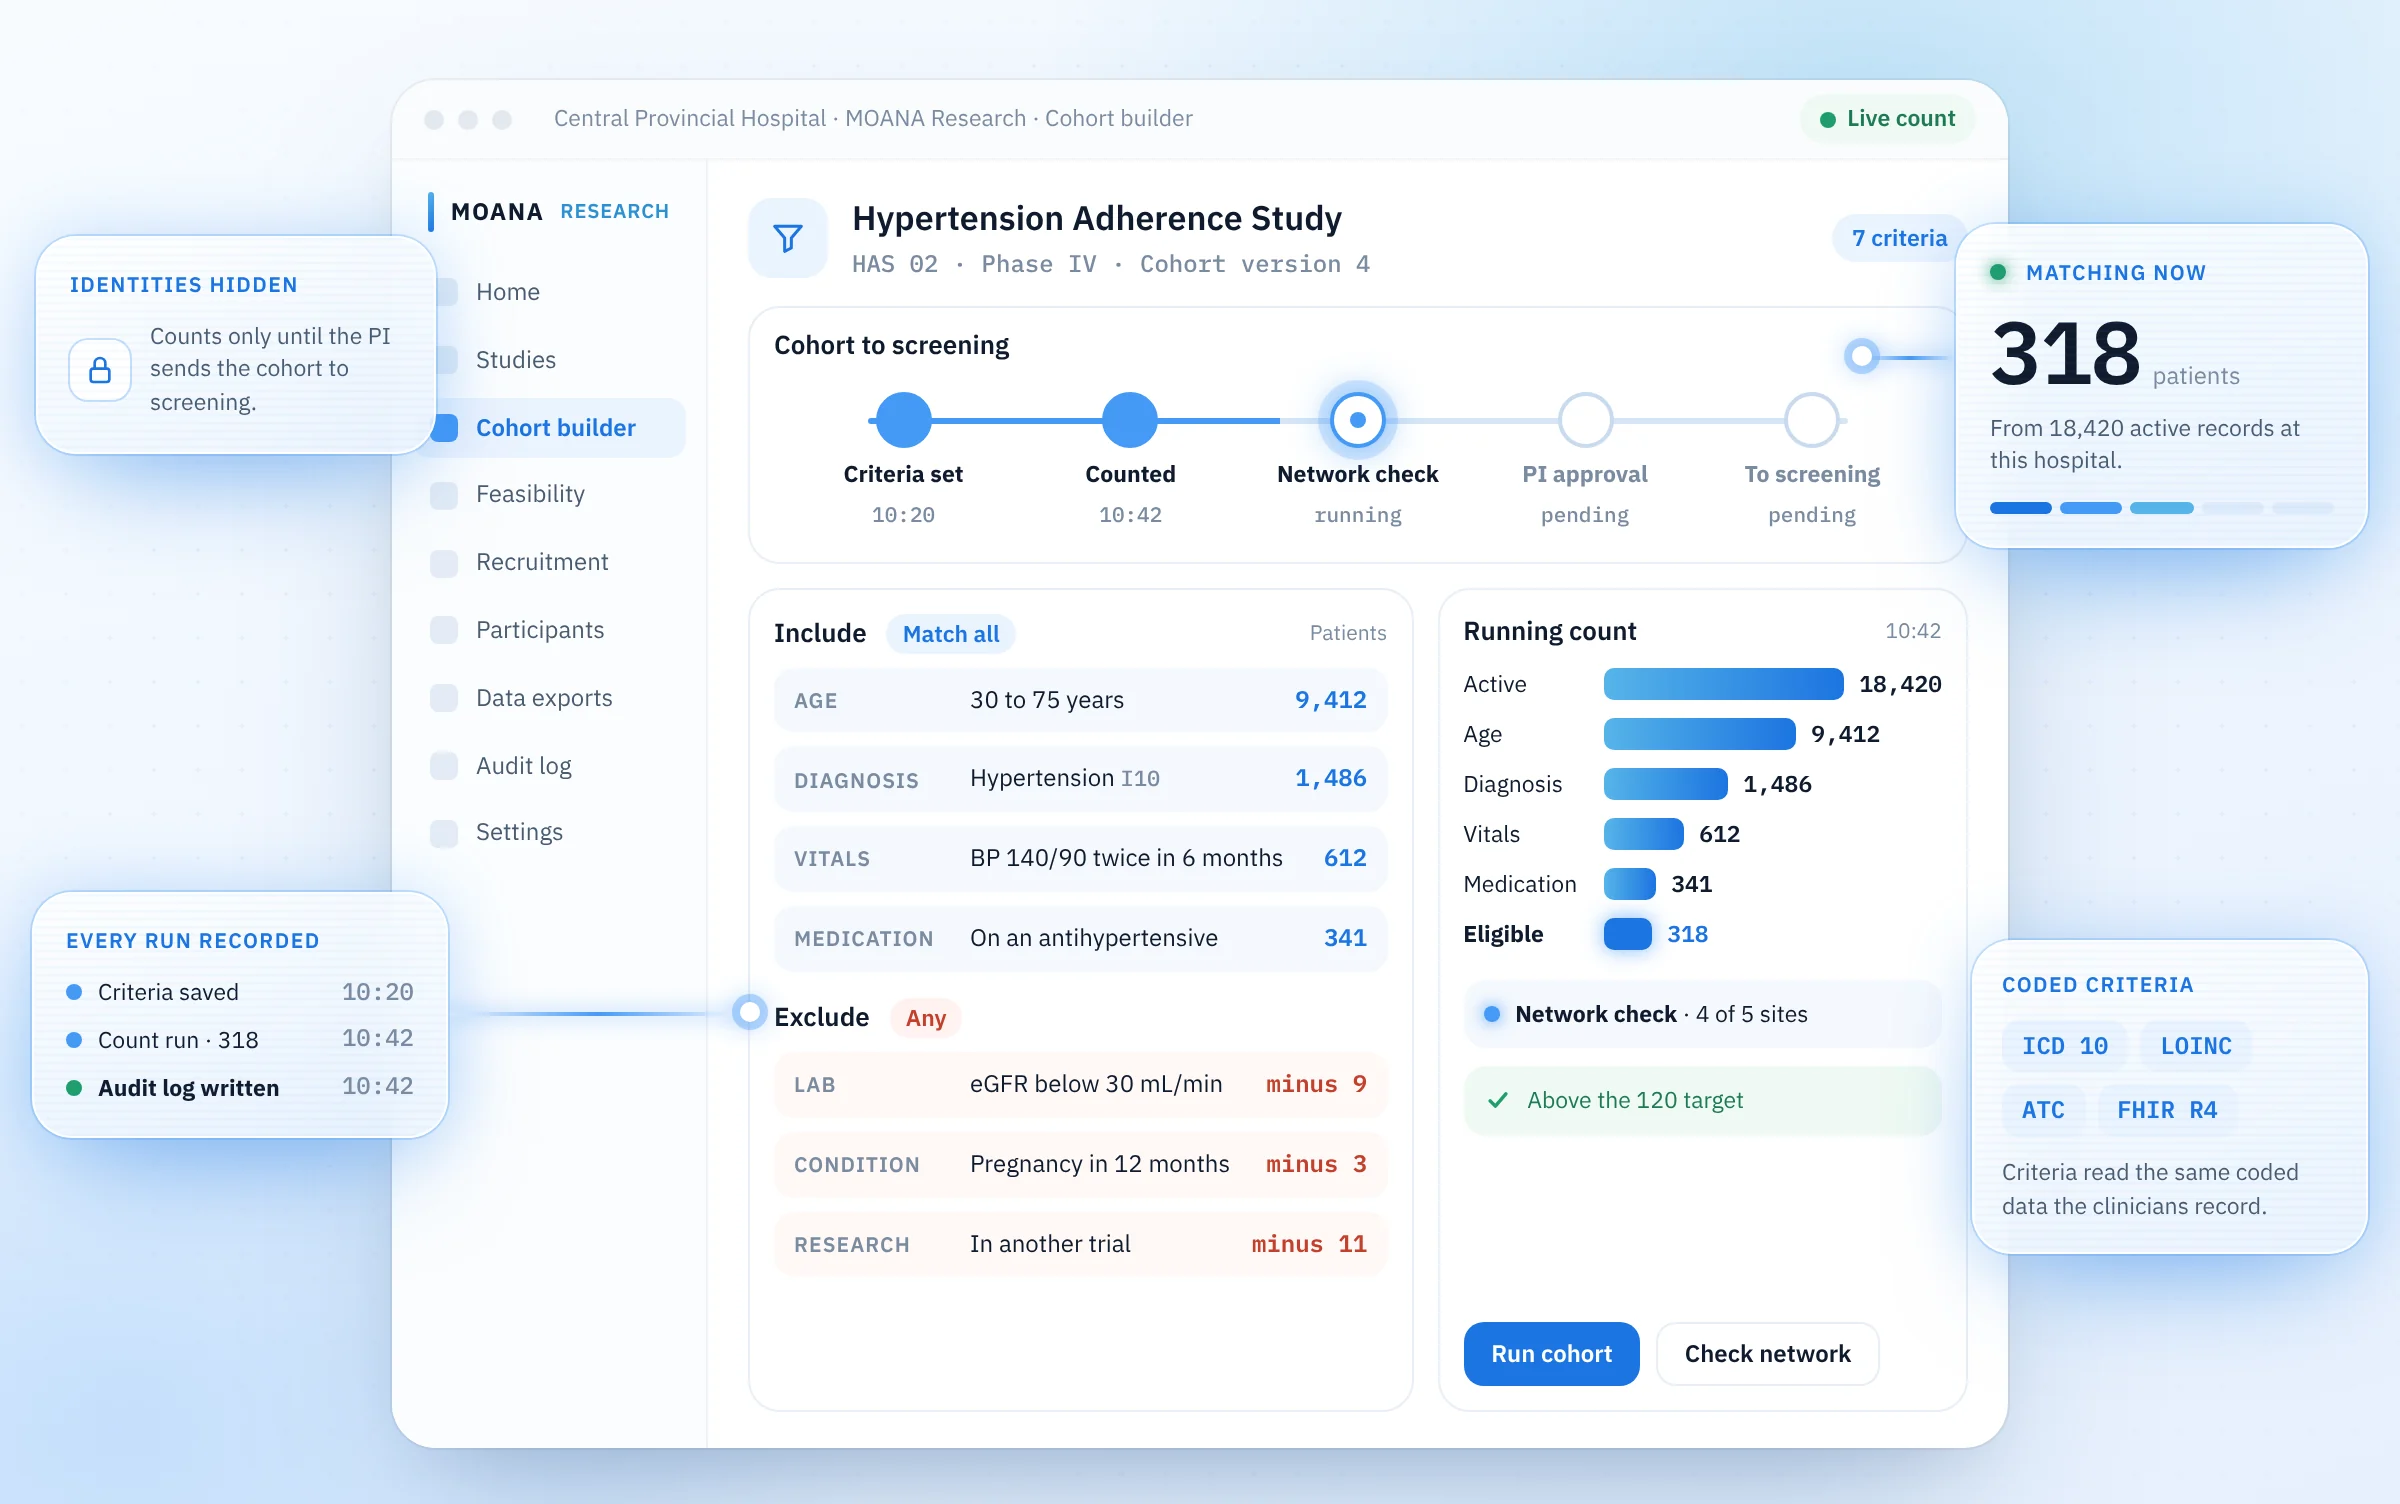
In Moana, reports are produced from the encounters recorded during care. Clinicians, nurses, laboratory staff and pharmacists work in role based workspaces in MOANA Desktop, and their work is the data.
- One record per patient. MOANA EHR, MOANA LIS, the Moana Pharmacy Management System and hospital operations write to one record, so a national figure can draw on diagnoses, results and dispensing together.
- Coded at the point of care. Diagnoses in ICD 10 or ICD 11 and laboratory tests in LOINC, with SNOMED CT supported.
- Reports and analytics. Facility dashboards and indicator reports are computed from the encounters recorded in Moana rather than from tally sheets.
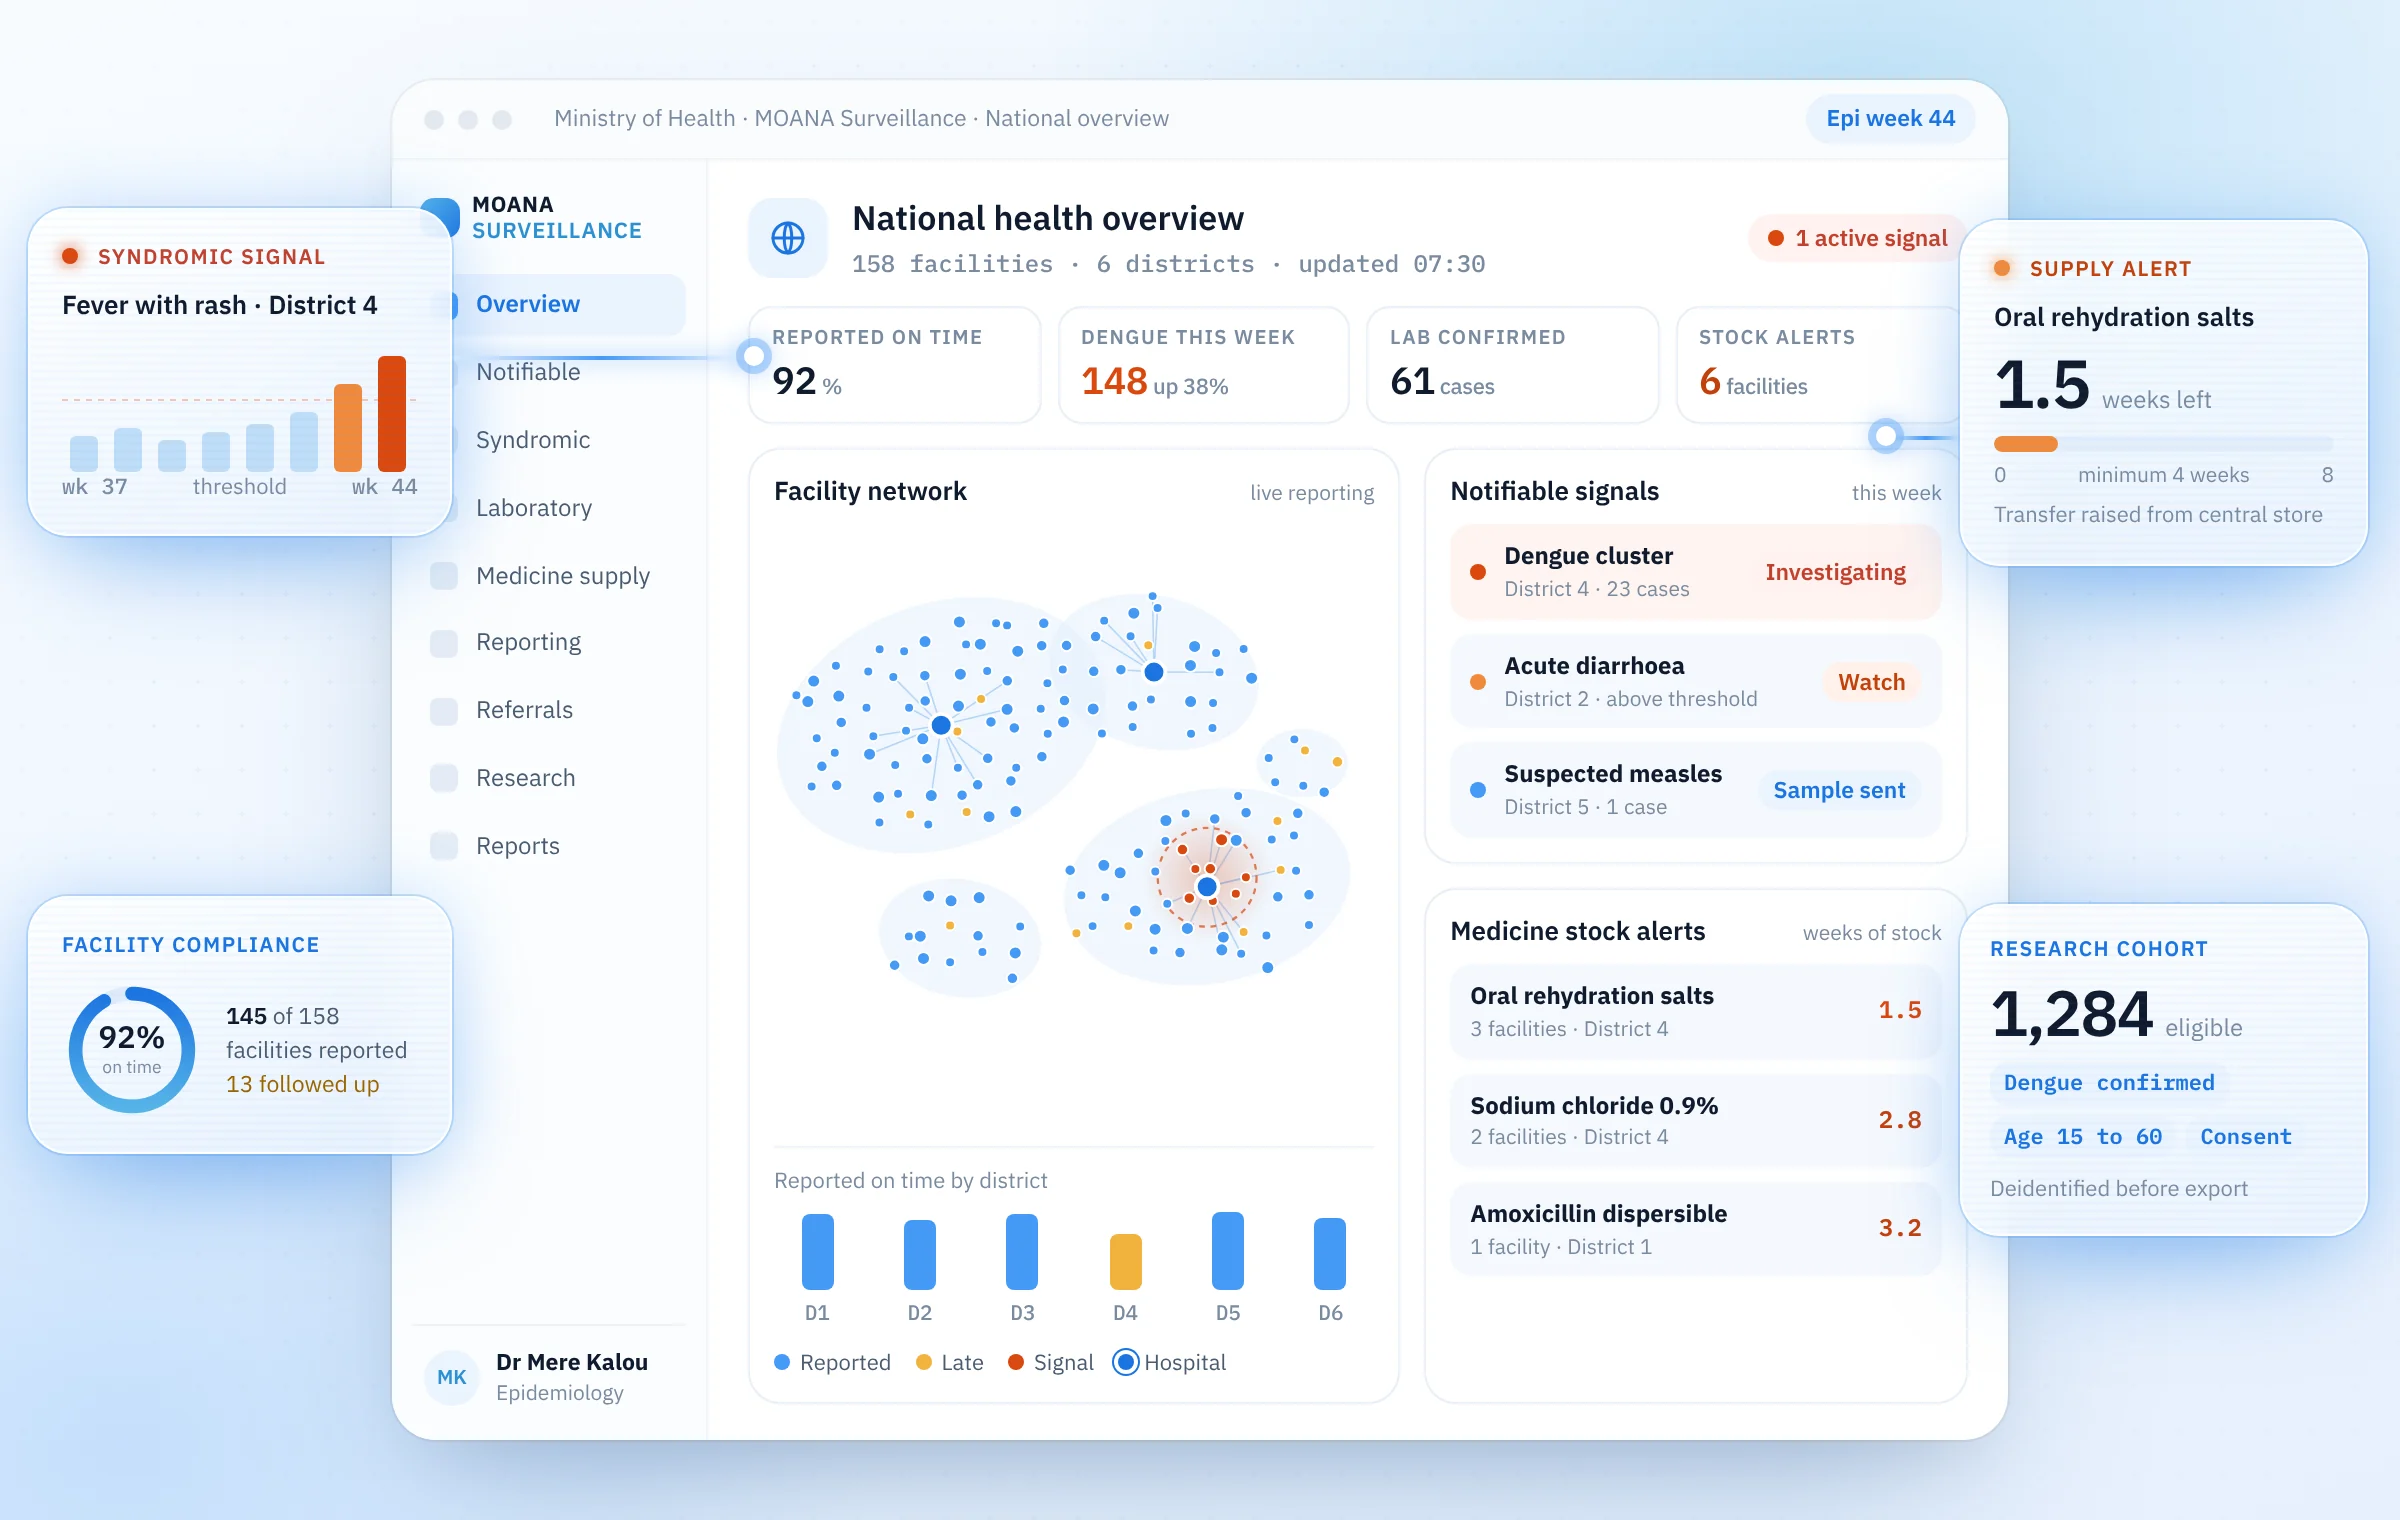
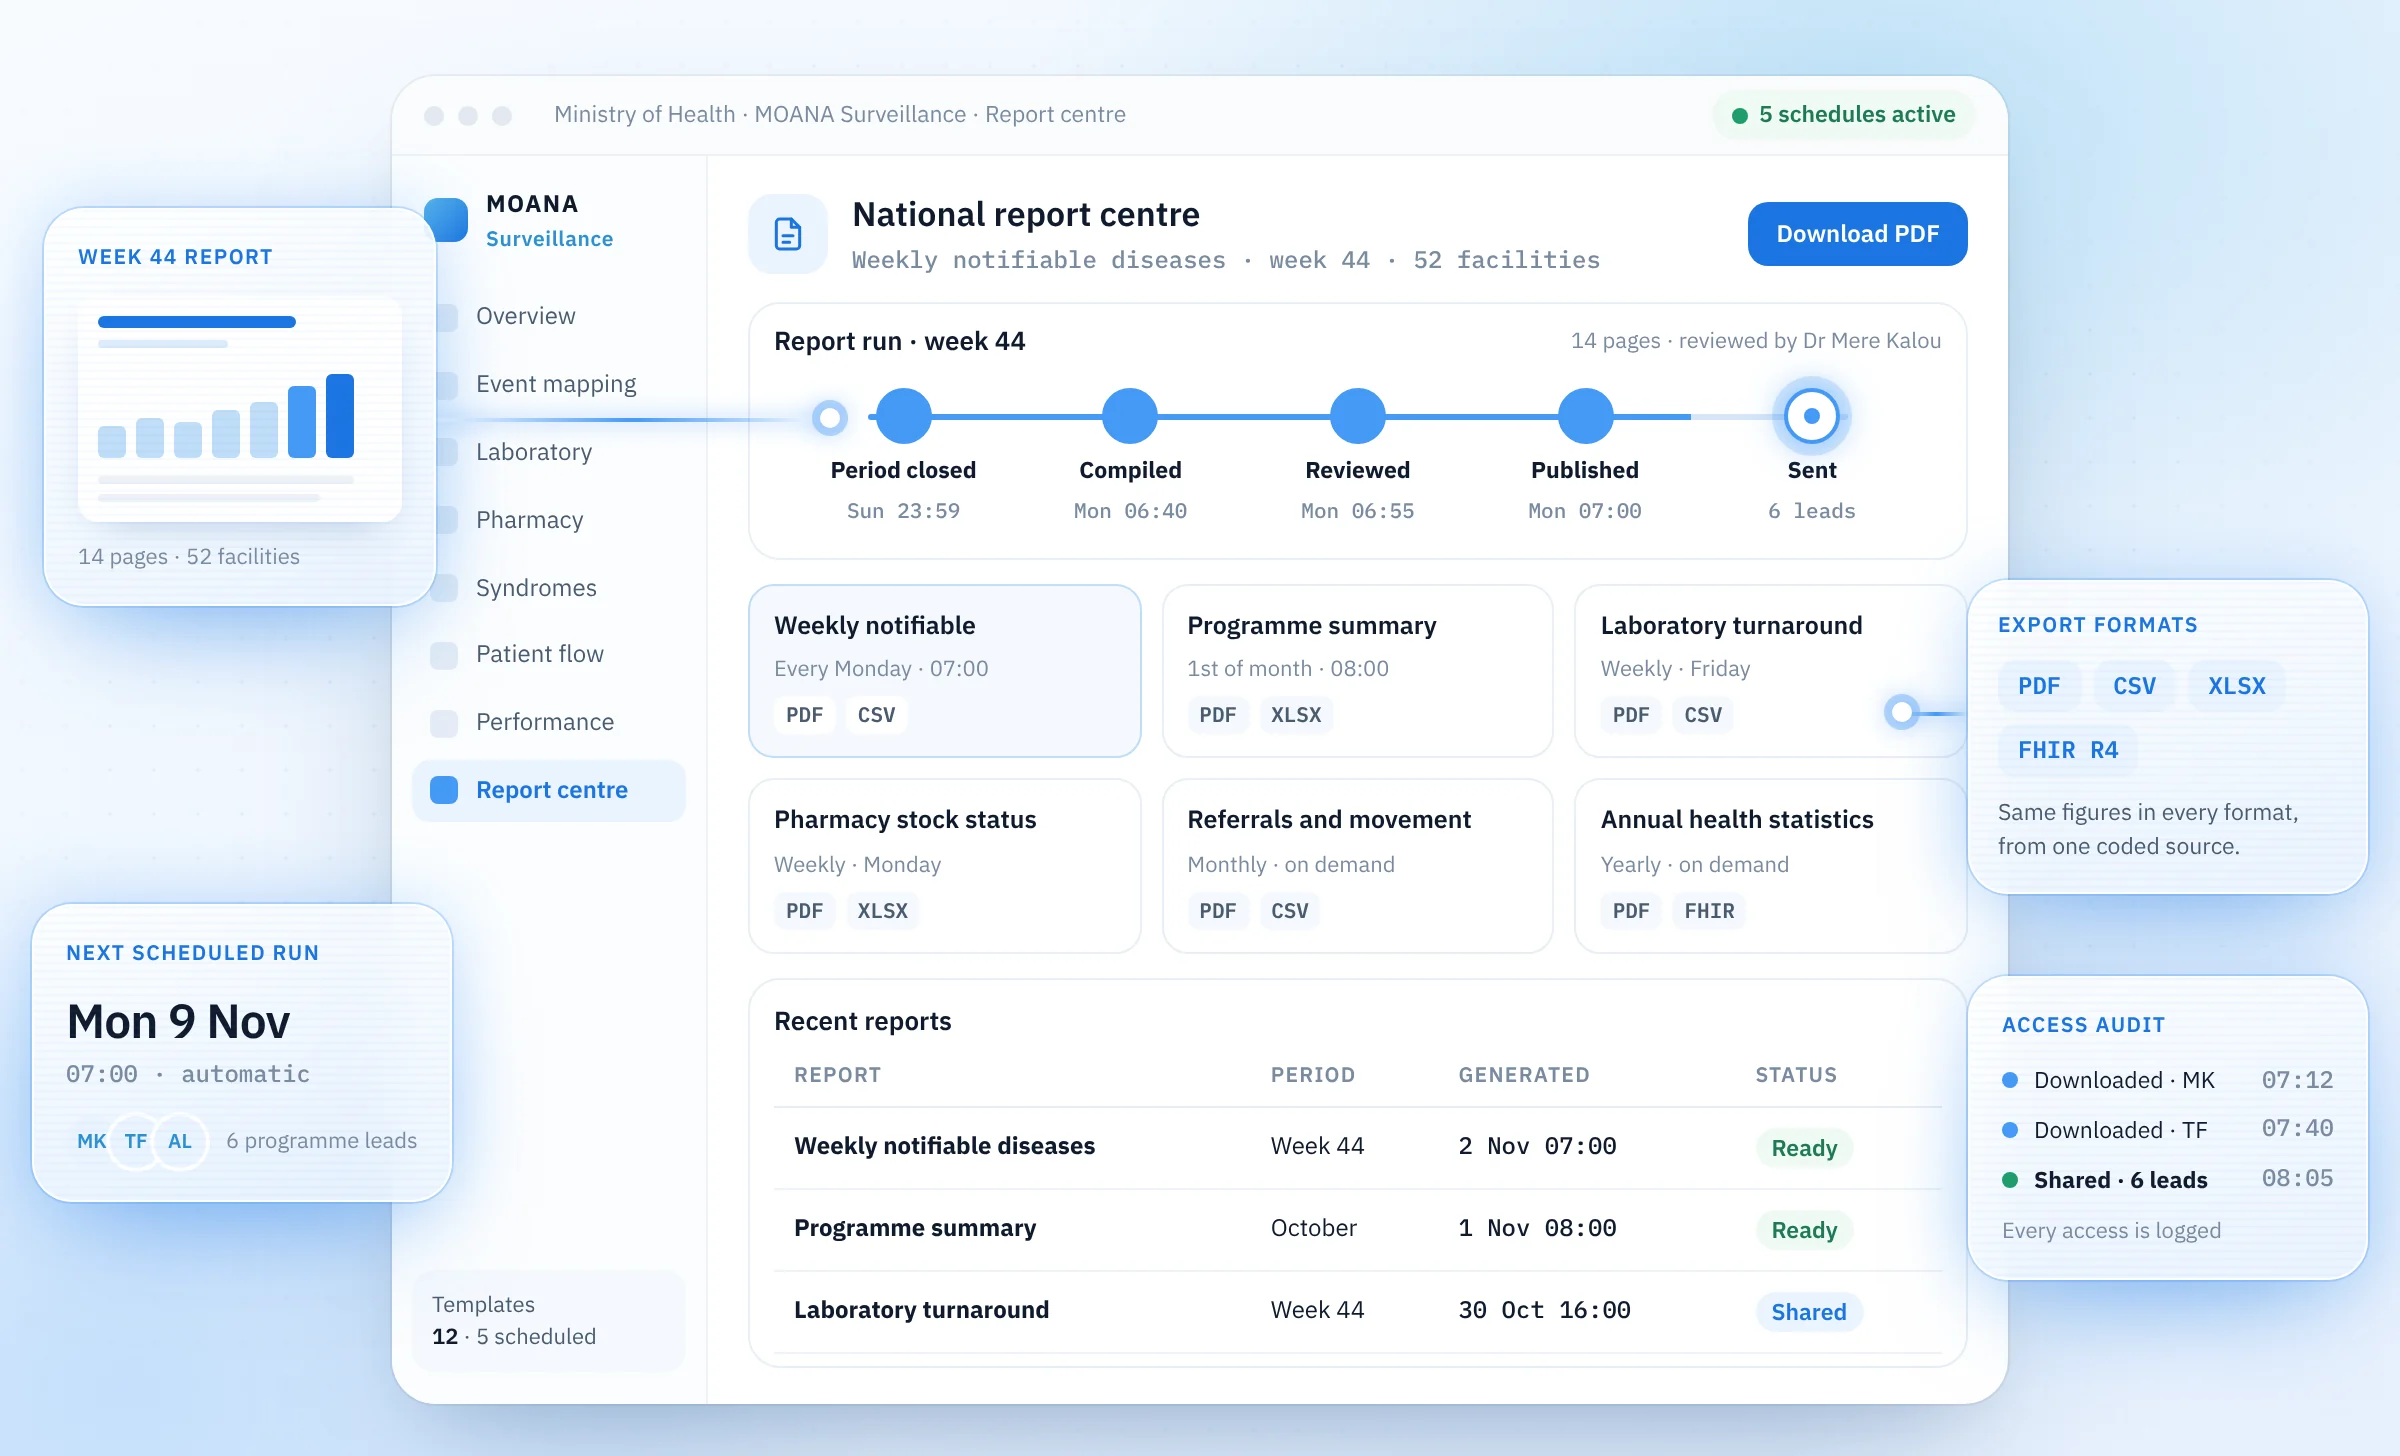
- National reporting. MOANA Surveillance monitors reporting compliance and data freshness by facility, produces scheduled national reports, reports aggregates to DHIS2 and exports them as FHIR MeasureReport bundles.
- Duplicate matching. Events are checked against the master patient index before they reach national figures.
- Audit. Every change is recorded in the audit log, and break glass access is audited.
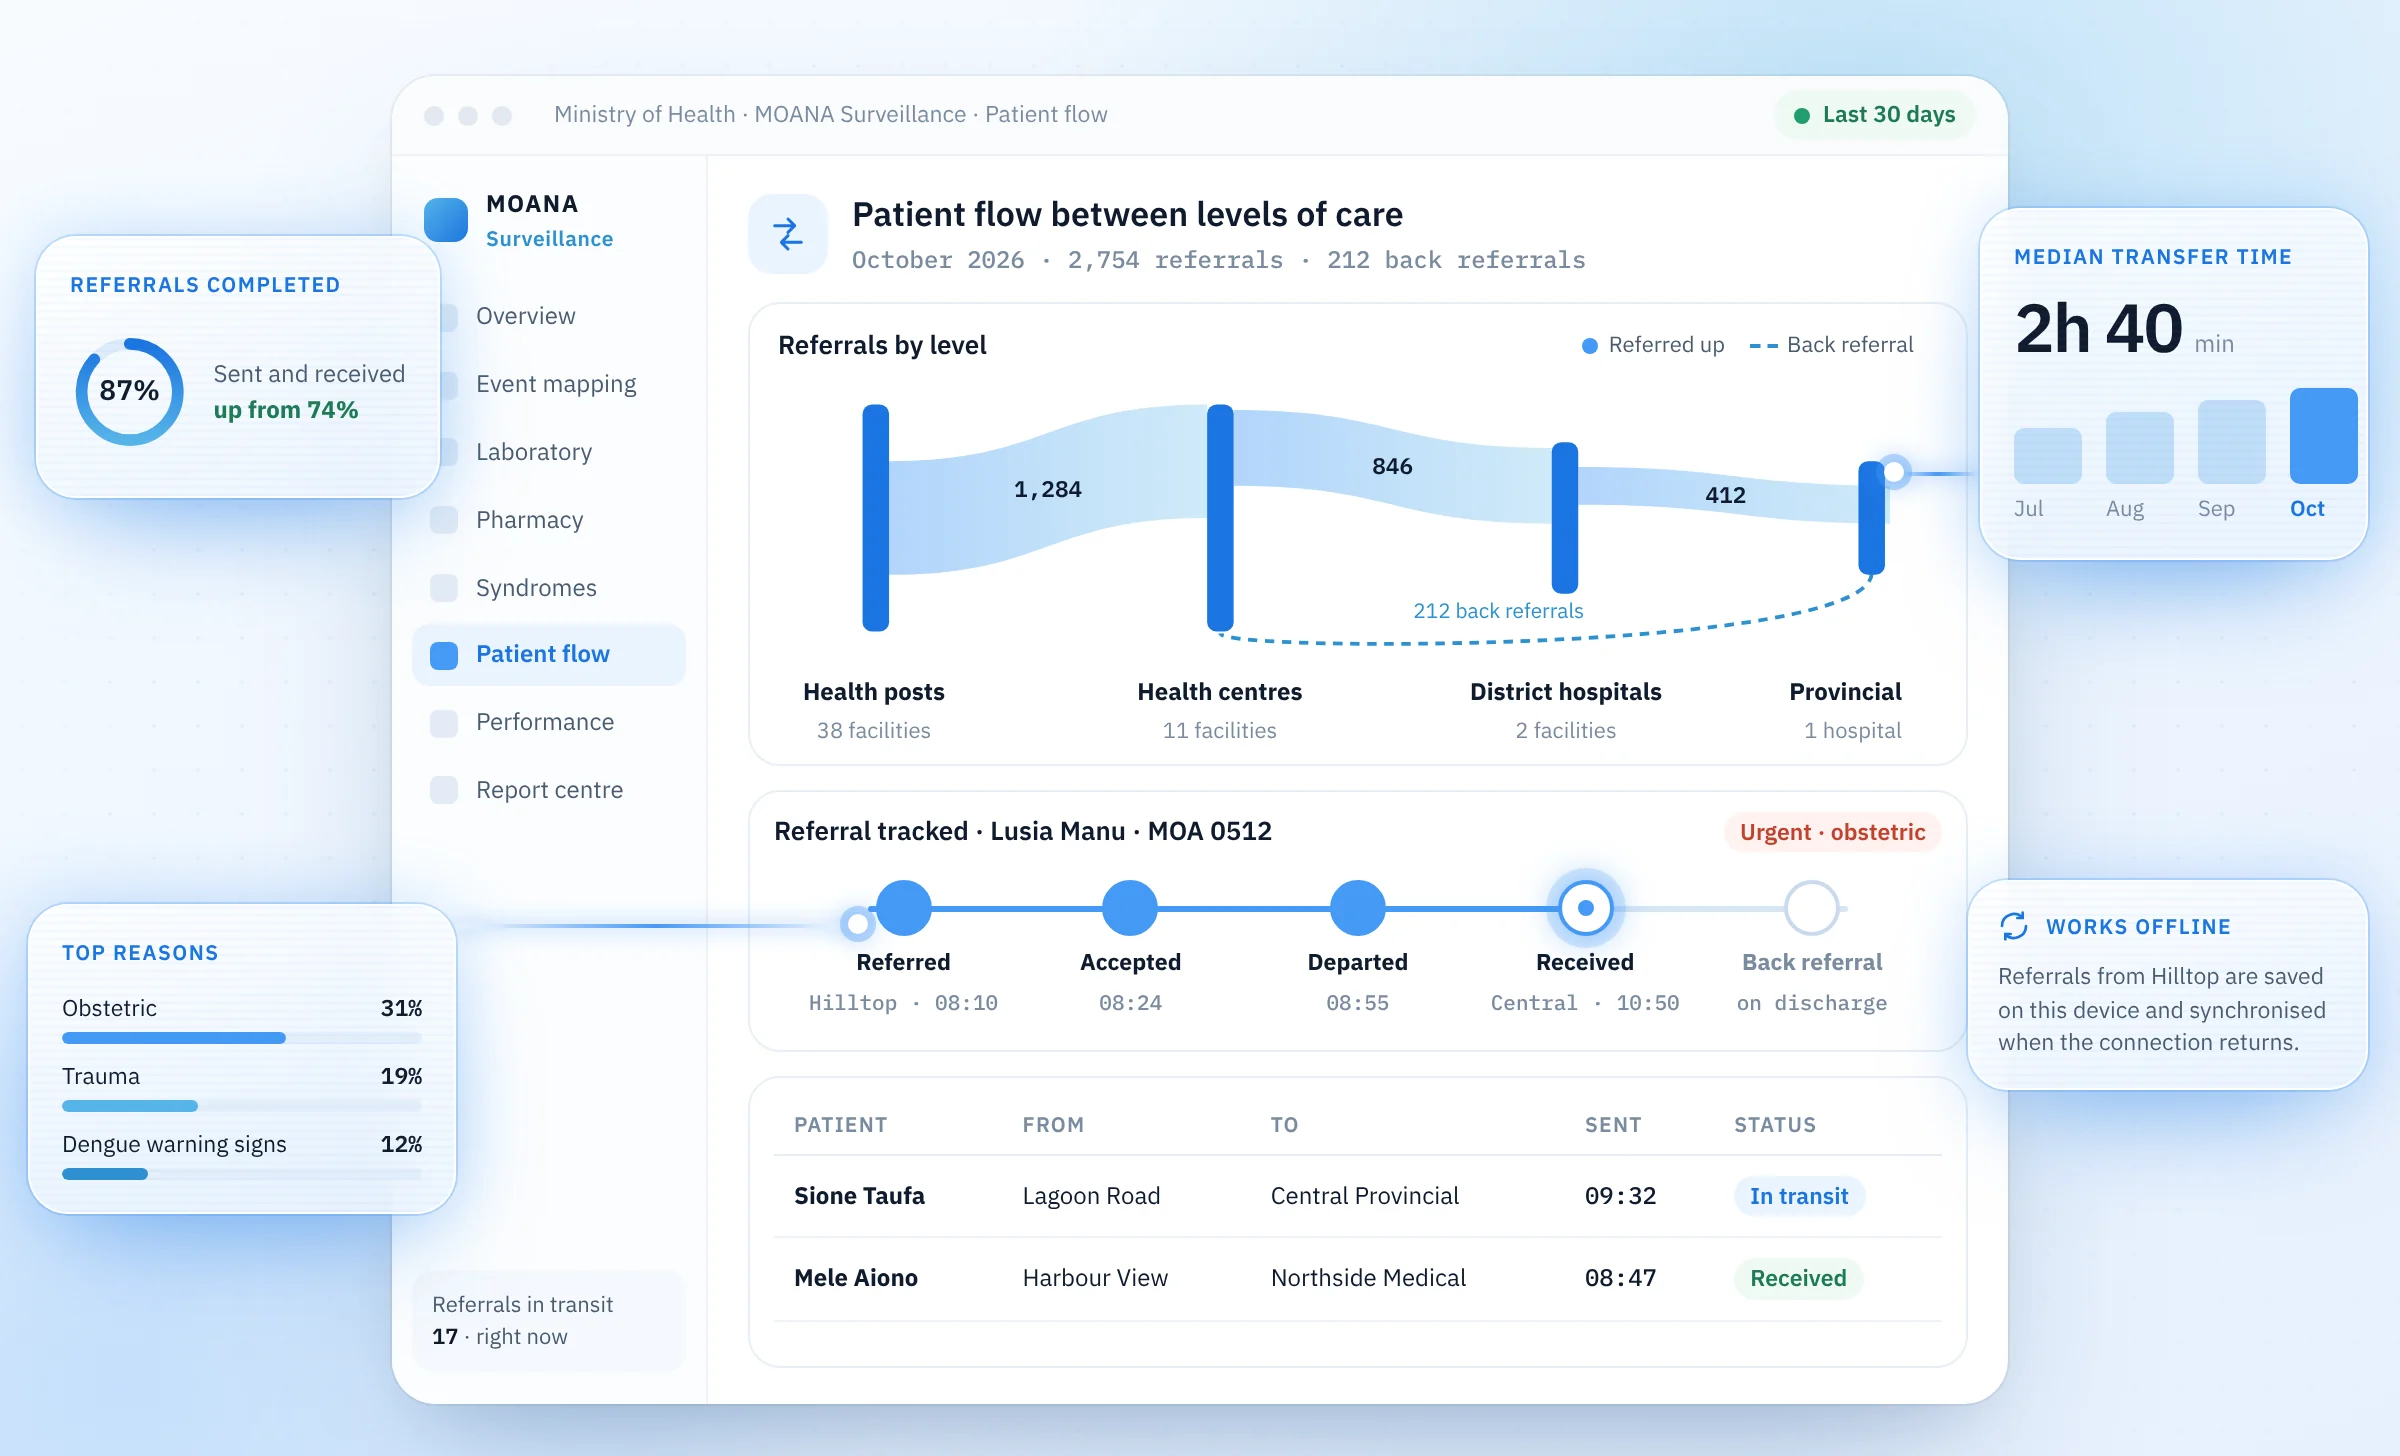
- Designed for unreliable connectivity. Work is saved on the device and synchronised when the connection returns, so late arriving encounters are added to the record rather than lost.
- Data sovereignty. The organisation that collects the data owns it.
Moana is live across clinics in Pakistan and clinics in the South Pacific. At ANGAU Memorial Provincial Hospital in Papua New Guinea, every department, including medical records, has been mapped and configured with its Officer in Charge, the Consultation Clinic is already live in the Moana system, and go live is expected in the coming weeks. See Moana for governments.
Frequently asked questions
What is traceable health reporting?
Reporting in which each national figure can be followed back to the encounters and patients that produced it, so its accuracy can be checked without a field recount.
Does computed reporting remove the need for data quality reviews?
No. It removes transcription error, but completeness of recording, coding quality and denominators still need review using the WHO dimensions [1].
Which indicators benefit most?
Indicators that require judgement or several steps of tallying, such as antenatal visits meeting a standard, where agreement between registers and reports was lowest in the Rwanda study [2].
Can computed returns go straight into DHIS2?
Yes. Aggregates can be submitted to DHIS2 using its data exchange features or standards such as IHE ADX [5][7].
How are corrections handled after a period is closed?
The return is revised with a recorded reason, and earlier versions are retained for audit, so a revision is visible rather than silent.
Sources
- Data Quality Review toolkit, Module 3: site assessment of data quality, World Health Organization, 2020
- Health management information system (HMIS) data verification: a case study in four districts in Rwanda, PLoS ONE, 2020
- Improving the quality of routine maternal and newborn data captured in primary health facilities in Gombe State, Northeastern Nigeria: a before and after study, BMJ Open (Bhattacharya and colleagues), 2020
- The burden of recording and reporting health data in primary health care facilities in five low and lower middle income countries, BMC Health Services Research (Siyam and colleagues), 2021
- DHIS2: the world's largest HMIS, DHIS2, University of Oslo, accessed 2026
- DHIS2 Tracker, DHIS2, University of Oslo, accessed 2026
- Aggregate Data Exchange profile, IHE International, accessed 2026
- MeasureReport resource, HL7 International, accessed 2026
- Framework and Standards for Country Health Information Systems, second edition, World Health Organization and Health Metrics Network, 2008
- Western Pacific Region achieves milestone: 19 countries complete comprehensive health information system assessments, WHO Regional Office for the Western Pacific, 2026
- Update on eHealth and Health Information Systems in the Pacific, Pacific Community, 2019
- SMART Guidelines, World Health Organization, accessed 2026