Laboratory Quality Control: Westgard Rules and Levey Jennings Charts
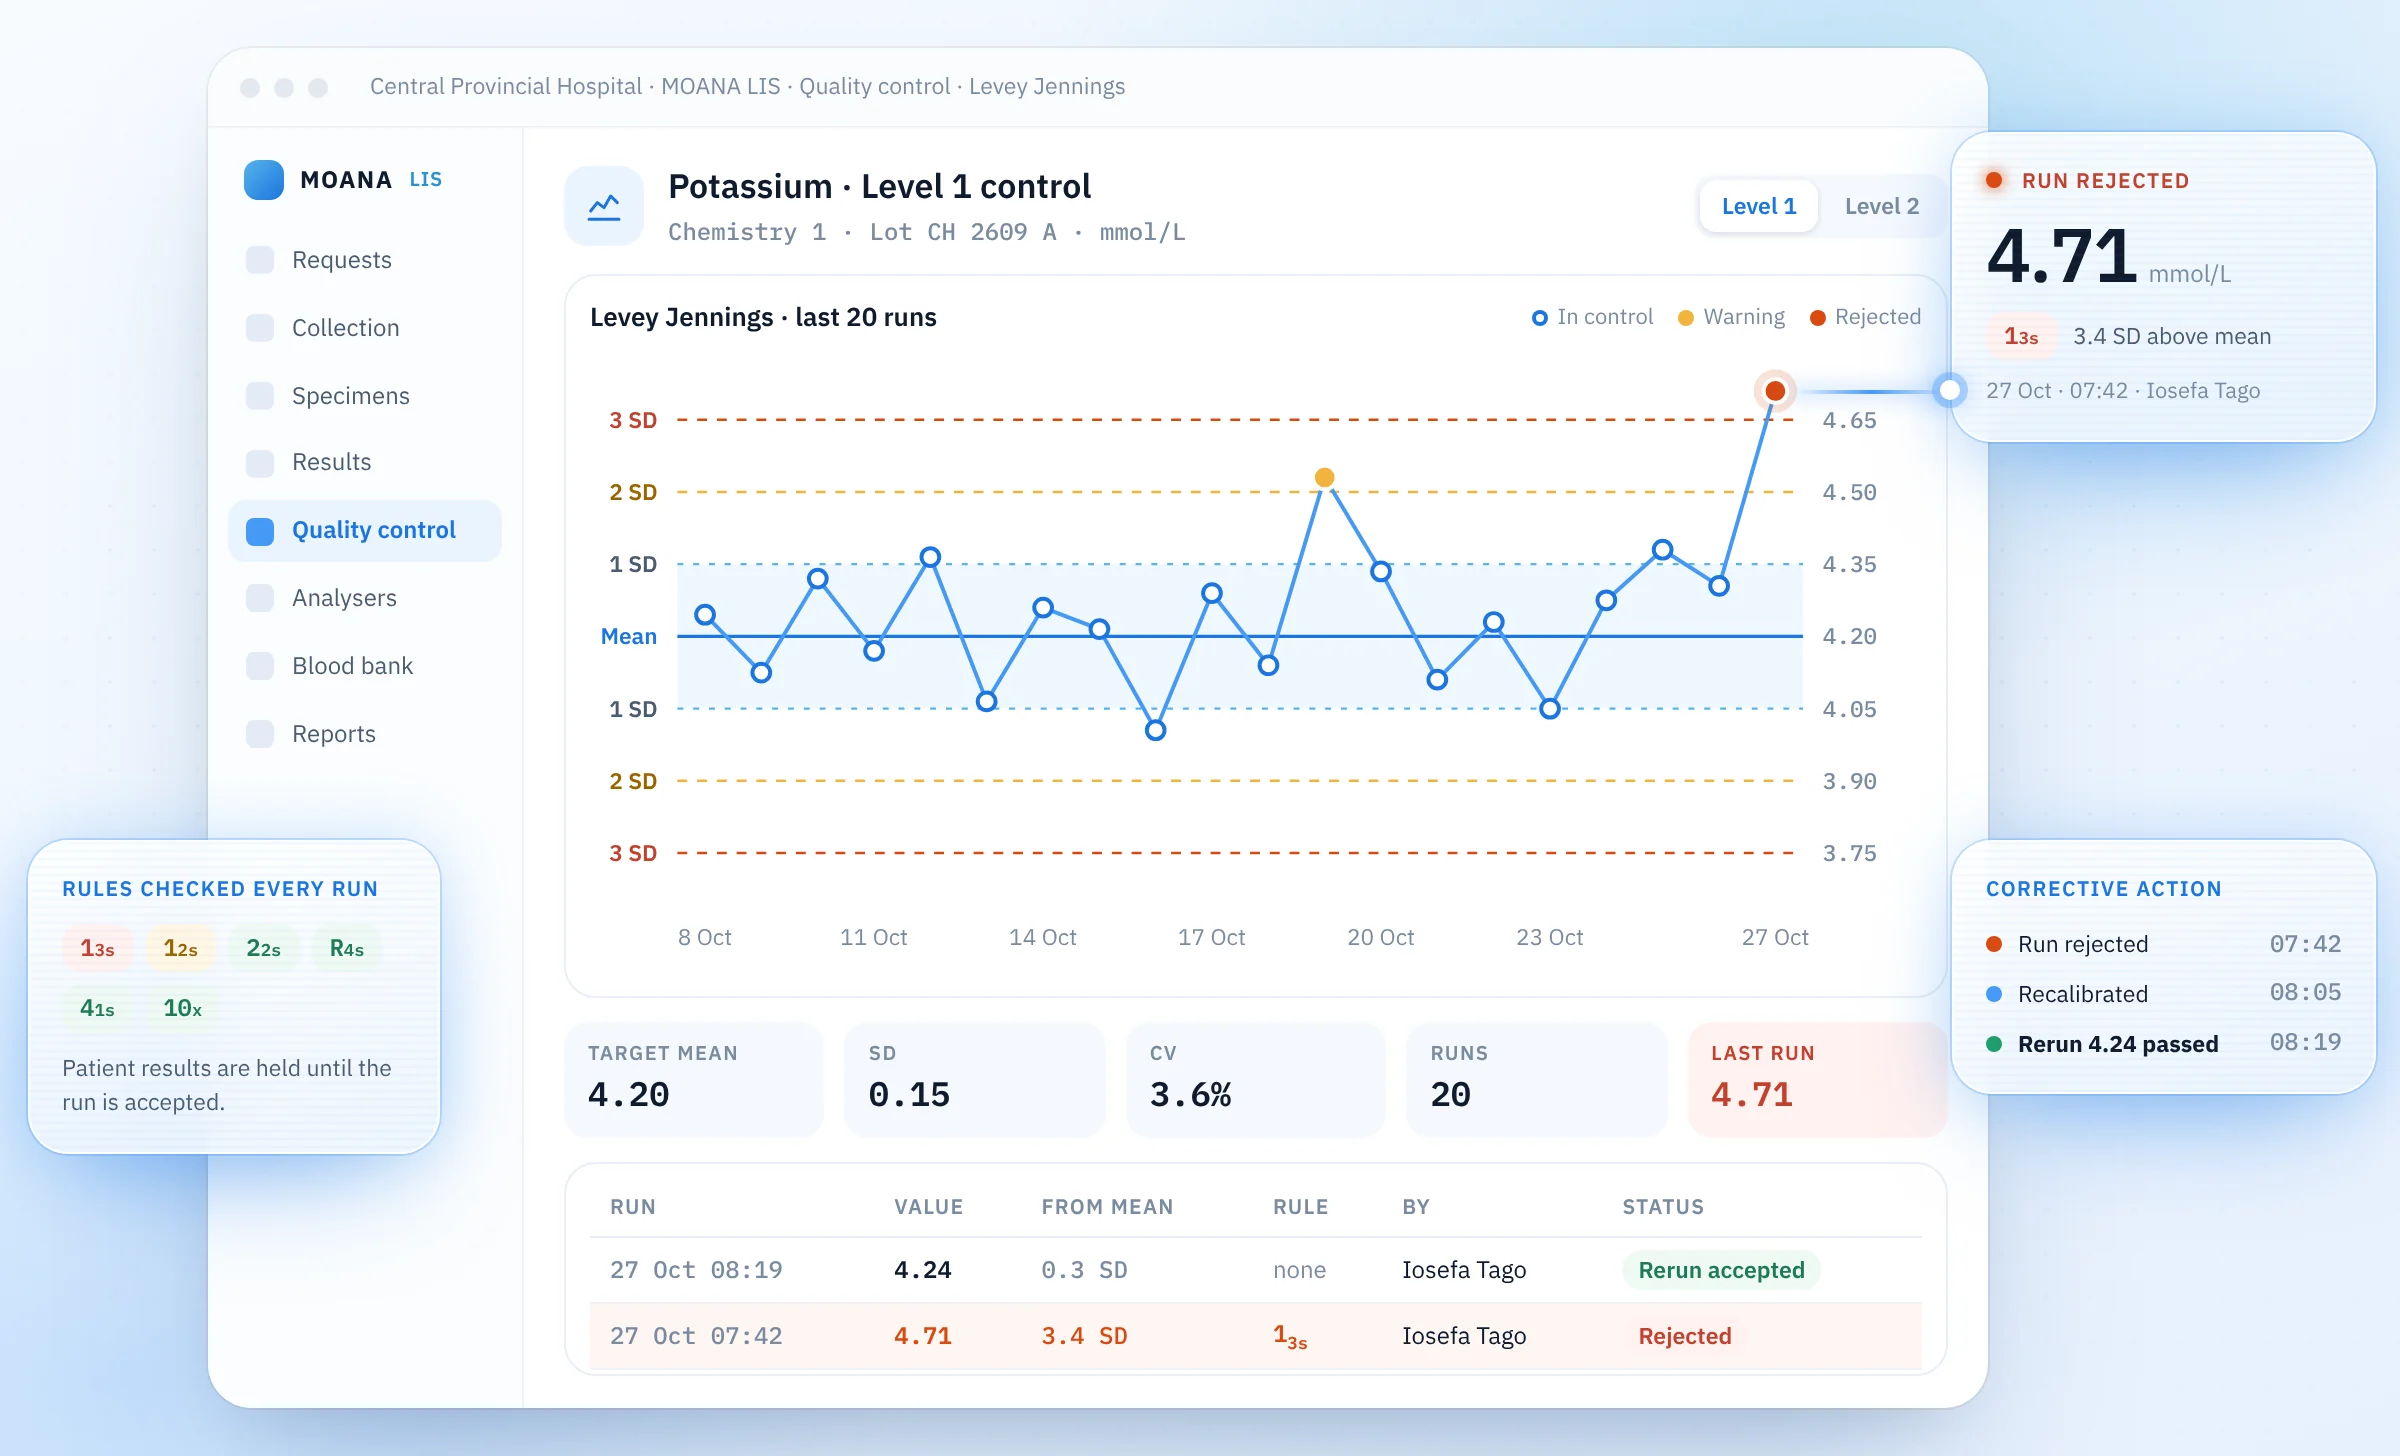
Westgard rules are a set of statistical decision rules, applied to control results plotted on a Levey Jennings chart, that tell a laboratory whether an analytical run is in control and its patient results can be released. Used together, the rules detect both random and systematic error while keeping false rejections low, and a laboratory information system should apply them automatically to every run.
Internal quality control is the laboratory's daily check that its methods are producing reliable numbers. WHO's laboratory quality handbook is unambiguous about the consequence of a failed check: "Patient results must not be reported until the problem is resolved and the controls indicate proper performance" [1]. This guide explains how the chart and the rules work, how to choose rules for each test, and what software must do to make QC a control rather than a record.
Where statistical quality control came from
Statistical process control was developed by Walter Shewhart at Bell Telephone Laboratories, who set out its scientific basis in 1931 [2]. Levey and Jennings introduced statistical control methods to clinical laboratories in 1950, and an alternative developed by Henry and Segalove, in which a stable reference sample is analysed repeatedly and individual values are plotted directly, is what is now commonly called the Levey Jennings chart [2]. James Westgard introduced his rules in 1977 and published the multirule Shewhart chart in 1981 [6].
Building a Levey Jennings chart
The chart is simple to construct and hard to misuse if the steps are followed.
- Select control material appropriate to the test and method.
- Assay the control under routine conditions and obtain at least 20 values [2].
- Calculate the mean and standard deviation (SD) from those values. WHO's handbook uses a set of 20 control values for the same purpose [1].
- Draw horizontal lines at the mean and at plus and minus 1, 2 and 3 SD [1].
- Label the chart with the test name and the control lot number, and plot each new control result by day or run [1].
Westgard's lesson on basic QC practice warns against using the bottle values printed by the manufacturer, or other estimated means and limits, in place of the laboratory's own data [2]. The chart must describe how this method performs in this laboratory.
Why a single 2 SD limit is not enough
The intuitive rule is to reject any run where a control falls outside 2 SD. WHO notes that with one control and a 2 SD limit, a correct run will be rejected 4.5% of the time [1], and Westgard's lesson puts the figure for a single control at about 5% [2]. The problem grows with more controls. Using a 1:2s rule with two controls is expected to generate about 9% false rejections, and with three controls about 14% [4].
False rejections are not harmless. Each one costs reagent, technologist time and turnaround, and repeated false alarms train staff to rerun controls until they pass, which is the habit QC exists to prevent. WHO's handbook is explicit that staff must not simply repeat testing without looking for sources of error and taking corrective action [1].
The Westgard multirule explained
The multirule combines several rules, each sensitive to a different error pattern, so that real errors are caught while chance variation is tolerated. In the classic procedure, the 1:2s rule acts as a warning that prompts inspection with the other rules rather than a rejection in itself [2].
| Rule | Reject when | Error typically detected |
|---|---|---|
| 1:2s | One control exceeds 2 SD (warning only in the classic procedure) | Prompts review |
| 1:3s | One control exceeds 3 SD | Random error |
| 2:2s | Two consecutive controls exceed the same 2 SD limit | Systematic error |
| R:4s | One control exceeds +2 SD and another exceeds minus 2 SD in the same run | Random error |
| 4:1s | Four consecutive controls exceed the same 1 SD limit | Systematic error |
| 10:x | Ten consecutive controls fall on the same side of the mean | Systematic error |
Rule definitions follow Westgard's published lists [2] [3], and the classification by error type follows a widely used reference guide [5]. With two control levels, the 2:2s rule can be applied within one level across runs or across both levels within a run, and the modern two control set uses 8:x in place of 10:x [3]. Westgard advises each laboratory to choose and document which rule interpretations it implements, noting that some are impractical without suitable software [3].
Random and systematic error
WHO's handbook distinguishes the two. Random error produces variation with no pattern and generally does not reflect a failure in the system. Systematic error indicates a failure that "can and should be corrected" [1]. The handbook describes two forms of systematic error to watch for on the chart [1]:
- Shift: an abrupt change followed by six or more consecutive results on one side of the mean, clustered around a new mean.
- Trend: values moving gradually but continually in one direction over six or more runs.
In both cases the handbook directs that results are rejected and the source investigated and corrected before patient samples are reported [1].
Matching rules to method performance with Sigma metrics
Applying the same rules to every test treats a highly precise assay and a marginal one alike. Sigma metrics give a quantitative basis for choosing. The Sigma value is calculated as total allowable error minus bias, divided by the coefficient of variation, all expressed as percentages [7].
- Total allowable error (TEa) is the allowable difference from the true value, taken from a recognised specification. One study took TEa values from United States Clinical Laboratory Improvement Amendments guidelines [7].
- Bias is the systematic difference from a reference, often estimated from external quality assessment results [7].
- Coefficient of variation (CV) is the method's imprecision, calculated from internal QC data [7].
In a five month study of 20 analytes at a provincial hospital laboratory in China, Sigma values ranged from 2.23 for sodium to 19.93 for amylase. The authors recommended a single 1:3s rule with two control levels for analytes above 6 Sigma, and the full 1:3s/2:2s/R:4s/4:1s multirule with three control levels, twice a day, for analytes below 3 Sigma [7]. A study of therapeutic drug assays in New Delhi showed that the Sigma value depends heavily on the TEa target chosen, and that the same bias and precision produced distinctly different Sigma scores under different targets [8]. The choice of TEa source should therefore be a documented laboratory decision.
Westgard has argued that once a method's Sigma metric is known, the number of rejection rules can be reduced, with few or no warning rules, because each added warning rule adds about 1% false rejection [4].
| Sigma performance | Suggested QC approach |
|---|---|
| Above 6 | Fewer rules and controls, for example a single 1:3s rule with two levels [7] |
| 3 to 6 | Multirule with two levels, adjusted to performance [7] |
| Below 3 | Full multirule, more control levels and more frequent runs, plus method improvement [7] |
Internal QC, external assessment and accreditation
Internal QC confirms that the analytical system is working before results are released; external quality assessment compares the laboratory's results against peers using samples supplied by an external agency, usually monthly [8]. The two are complementary: external assessment supplies the bias estimate, internal QC supplies the imprecision, and Sigma combines them.
QC records are among the first things an auditor examines. ISO 15189:2022, the current edition of the international standard for medical laboratory quality and competence, has a three year transition after which the 2012 edition is no longer recognised under the ILAC Arrangement [9]. WHO's SLIPTA checklist, based mainly on ISO 15189:2022, is organised in twelve sections matching the twelve quality system essentials, of which process control, including quality control, is one [10] [1]. The wider functions an accreditation ready laboratory needs from its software are covered in the guide on what a laboratory information system should do.
What software must do
Paper Levey Jennings charts work, but they rely on someone plotting every point, applying every rule and refusing to release results when a rule fails. Software should make the correct behaviour the default.
- Calculate the mean and SD from the laboratory's own data for each analyte, level and control lot.
- Plot every control result automatically and apply the selected rules to each run.
- Hold patient results from a run that violates a rejection rule until QC is accepted.
- Require a recorded corrective action before the run is released.
- Allow rules to be selected per analyte, so Sigma based QC design can be implemented.
- Keep the full QC history, including lot changes and recalculations, for audit.
How MOANA LIS enforces quality control
MOANA LIS applies quality control inside the testing workflow rather than beside it. Control results are captured with each run, from the analyser where MOANA LIS integrates with the instrument or by manual entry where it does not, and plotted on Levey Jennings charts for each analyte and control level.
Westgard rules are evaluated for every run. When a rule is violated, the run is flagged so the scientist can investigate and correct the problem before patient results are verified and dispatched to the clinician. Control results, rule outcomes and the subsequent verification are written to the audit log with the user and time.
Because charts and rule outcomes are held in the system, the quality manager can review shifts and trends across analytes and benches, and present the QC history for any result during an ISO 15189 or SLIPTA audit. The same record links each patient result to the run, the controls that preceded it and the person who verified it. Verified results then pass to critical value checks and dispatch, described in the guide on critical value reporting.
MOANA LIS is designed for unreliable connectivity. QC entries and verification decisions are saved on the device and synchronised when the connection returns, so a dropped link does not interrupt the bench. It is available standalone for independent and reference laboratories, or as part of the Moana platform with one patient record shared with clinicians. The laboratories solution describes how Moana configures the test catalogue, control materials and rules with each laboratory.
Frequently asked questions
How many control values are needed to set up a Levey Jennings chart?
At least 20 values obtained under routine conditions, from which the mean and SD are calculated [2]. WHO's handbook uses the same number [1]. Limits should come from the laboratory's own data, not the manufacturer's bottle values [2].
Is the 1:2s rule a rejection rule?
In the classic Westgard multirule it is a warning that prompts inspection with the other rules [2]. Used alone as a rejection rule with two controls it generates about 9% false rejections [4].
Which Westgard rules should a laboratory use?
That depends on each method's performance. Sigma metrics, calculated from total allowable error, bias and CV, indicate whether a test needs the full multirule or a simpler rule set [7] [4]. The choice should be documented for each analyte [3].
What should happen when a QC rule is violated?
Stop testing, identify and correct the problem, recheck the controls, then repeat patient samples with another control. Patient results must not be reported until the controls indicate proper performance [1].
How often should controls be run?
WHO states that a control sample must be run with each set of patient samples [1]. Frequency and number of levels can then be adjusted to Sigma performance, with more frequent QC for poorer performing methods [7].
Sources
- Laboratory quality management system: handbook, World Health Organization, 2011
- Basic QC practices: lesson on Levey Jennings charts and control rules, Westgard QC, accessed 2026
- Fifty ways to apply Westgard rules, Westgard QC, accessed 2026
- When is it time to wean yourself off warning rules?, Westgard QC, 2025
- Westgard rules reference guide, CASRAI, accessed 2026
- A historical perspective of quality control, Medical Laboratory Observer, 2025
- Evaluating analytical quality in clinical biochemistry laboratory using Six Sigma, Biochemia Medica, 2018
- Sigma metric evaluation of drugs in a clinical laboratory: importance of choosing appropriate total allowable error, Journal of Laboratory Physicians, 2021
- ISO 15189:2022 for medical labs published, International Laboratory Accreditation Cooperation, 2022
- WHO Stepwise Laboratory Quality Improvement Process Towards Accreditation (SLIPTA) Checklist, African Society for Laboratory Medicine, 2023