Disease surveillance from the clinical record: IDSR and syndromic
Disease surveillance from the clinical record means that the diagnoses, laboratory results and dispensing events already recorded during care are coded, classified and counted automatically, so a ministry sees signals as cases are recorded rather than when paper returns arrive. It does not replace IDSR, syndromic or event based surveillance; it supplies them with timelier and verifiable data, in support of the International Health Regulations requirement to detect unusual events and report essential information immediately [1].
This guide covers the surveillance obligations ministries work under, the main surveillance models, why paper based reporting is slow, what the clinical record adds, how to design the pipeline from diagnosis to alert, and how to measure whether it is working.
The obligations: International Health Regulations
The International Health Regulations (2005) set the legal frame for national surveillance. Under Article 6, each State Party must notify WHO, through its National IHR Focal Point, of events that may constitute a public health emergency of international concern within 24 hours of assessing the public health information, using the decision instrument in Annex 2 [1][2]. WHO also publishes case definitions for the four diseases that require notification in all circumstances [2].
The regulations place requirements at the local level too. Annex 1 asks that the local community and primary public health response level be able "to detect events involving disease or death above expected levels for the particular time and place" and "to report all available essential information immediately to the appropriate level of healthcare response" [1].
Both requirements depend on what happens in facilities. The 24 hour clock starts with assessment, and assessment cannot start until the facility signal reaches the people who assess it.
The main surveillance models
Ministries usually operate several surveillance models side by side. Each has a different relationship with the clinical record.
| Model | What is reported | Typical source | What the record can supply |
|---|---|---|---|
| Indicator based (for example IDSR) | Weekly or monthly counts of priority diseases | Facility registers and tally sheets | Counts computed from coded diagnoses |
| Syndromic | Counts of patients with a defined syndrome | Sentinel sites, emergency departments | Diagnoses mapped to syndromes as they are recorded |
| Case based | One record per case with person, place and time | Case investigation forms | The case record, prefilled from the encounter |
| Laboratory based | Confirmed results for notifiable conditions | Laboratory registers | Results released in the laboratory system |
| Event based | Unusual events, clusters, rumours | Reports from clinicians and communities | A structured route for clinicians to flag an event |
Integrated Disease Surveillance and Response
IDSR is the integrated model used across the WHO African Region. Its technical guidelines, now in a third edition published in 2019, were prepared by the WHO Health Emergencies Programme with the region's disease surveillance programmes, with technical review from the US CDC and USAID [3].
Syndromic surveillance
WHO describes early warning systems in emergencies as usually syndromic: each condition is identified by a case definition, and an alert is triggered when a set threshold is crossed [5]. The Pacific Syndromic Surveillance System, established in 2010, is a regional example. It covers 23 Pacific Island countries with weekly reporting, began with four syndromes (acute fever and rash, diarrhoea, influenza like illness and prolonged fever) and later added acute respiratory infection, severe acute respiratory infection, pneumonia and COVID 19 [4]. Alert thresholds are automated: for most syndromes an alert fires at twice the recent average, and for acute fever and rash, severe acute respiratory infection and COVID 19 a single case is enough [4].
Why paper based surveillance is slow
Paper surveillance competes with every other reporting obligation in the facility. A 2021 study across five low and lower middle income countries found that monthly reporting took about nine hours per health worker, on top of registers that required an average of 25 mandatory cells per patient [11].
The consequences show in timeliness. Resolve to Save Lives and partners propose the 7 1 7 target: detect a suspected outbreak within 7 days of emergence, notify public health authorities within 1 day of detection, and complete early response actions within 7 days [6]. In a Lancet Global Health study of 41 outbreaks in five countries cited by Resolve to Save Lives, 54% met the detection target, 71% met the notification target, 49% met the early response target, and only one in four met all three [6].
Digitising the reporting step helps. A 2024 conference abstract from Sierra Leone reported that weekly IDSR reports on paper had completeness and timeliness below 50% before the 2014 to 2015 Ebola outbreak, and that after mobile reporting from facilities, weekly reports from 2017 to 2023 averaged 97% completeness and 100% timeliness; case based data capture rose from 40% in 2019 to 95% in 2023 [9]. Digitising the form, however, still leaves someone counting the register. Surveillance from the clinical record removes the count.
What the clinical record adds
The International Classification of Diseases has been described by WHO as "the foundation for identifying health trends and statistics worldwide" [10]. When diagnoses are coded at the point of care, in ICD 10 or ICD 11, they become surveillance data the moment they are saved.
Timeliness depends on automation, not only on data
An early study from seven emergency departments in southeastern Virginia illustrates both the promise and the trap [7]. Daily chief complaint data were grouped into seven syndromes, including fever, respiratory distress, diarrhoea and rash, and a statistical algorithm flagged unusual increases. Syndromic data showed the start of the influenza season in the week of 14 January 2002, ahead of the sentinel influenza system, which registered an increase in the week of 23 January. The authors also reported that manual categorisation and transfer by fax caused delays, so much of the detection was retrospective [7]. Coding at source and automated classification are what turn record data into early warning.
Clinical context travels with the case
Electronic case reporting from records adds information that a laboratory report lacks. In a 2023 evaluation from clinics in Illinois, electronic case reports included the history of present illness and reason for visit in 82% of reports, and identified 19% of gonorrhoea cases that electronic laboratory reporting had missed [8]. The same study found electronic case reports reached the health department later than laboratory reports, a reminder that the trigger rules matter: a case triggered at diagnosis must be sent at diagnosis [8].
Three streams, one picture
| Stream | Surveillance signal |
|---|---|
| Coded diagnoses | Syndromes and notifiable conditions by place and time |
| Laboratory results | Confirmations, positivity rates, critical results and turnaround |
| Pharmacy dispensing | Unusual use of antimalarials, antibiotics or oral rehydration salts, and stock pressure |
Designing the pipeline from diagnosis to alert
A surveillance pipeline built on the record has six steps.
- Code at source. Diagnoses in ICD, tests in LOINC, captured by the clinician or laboratory as part of the normal workflow. See clinical terminologies: ICD, SNOMED CT and LOINC.
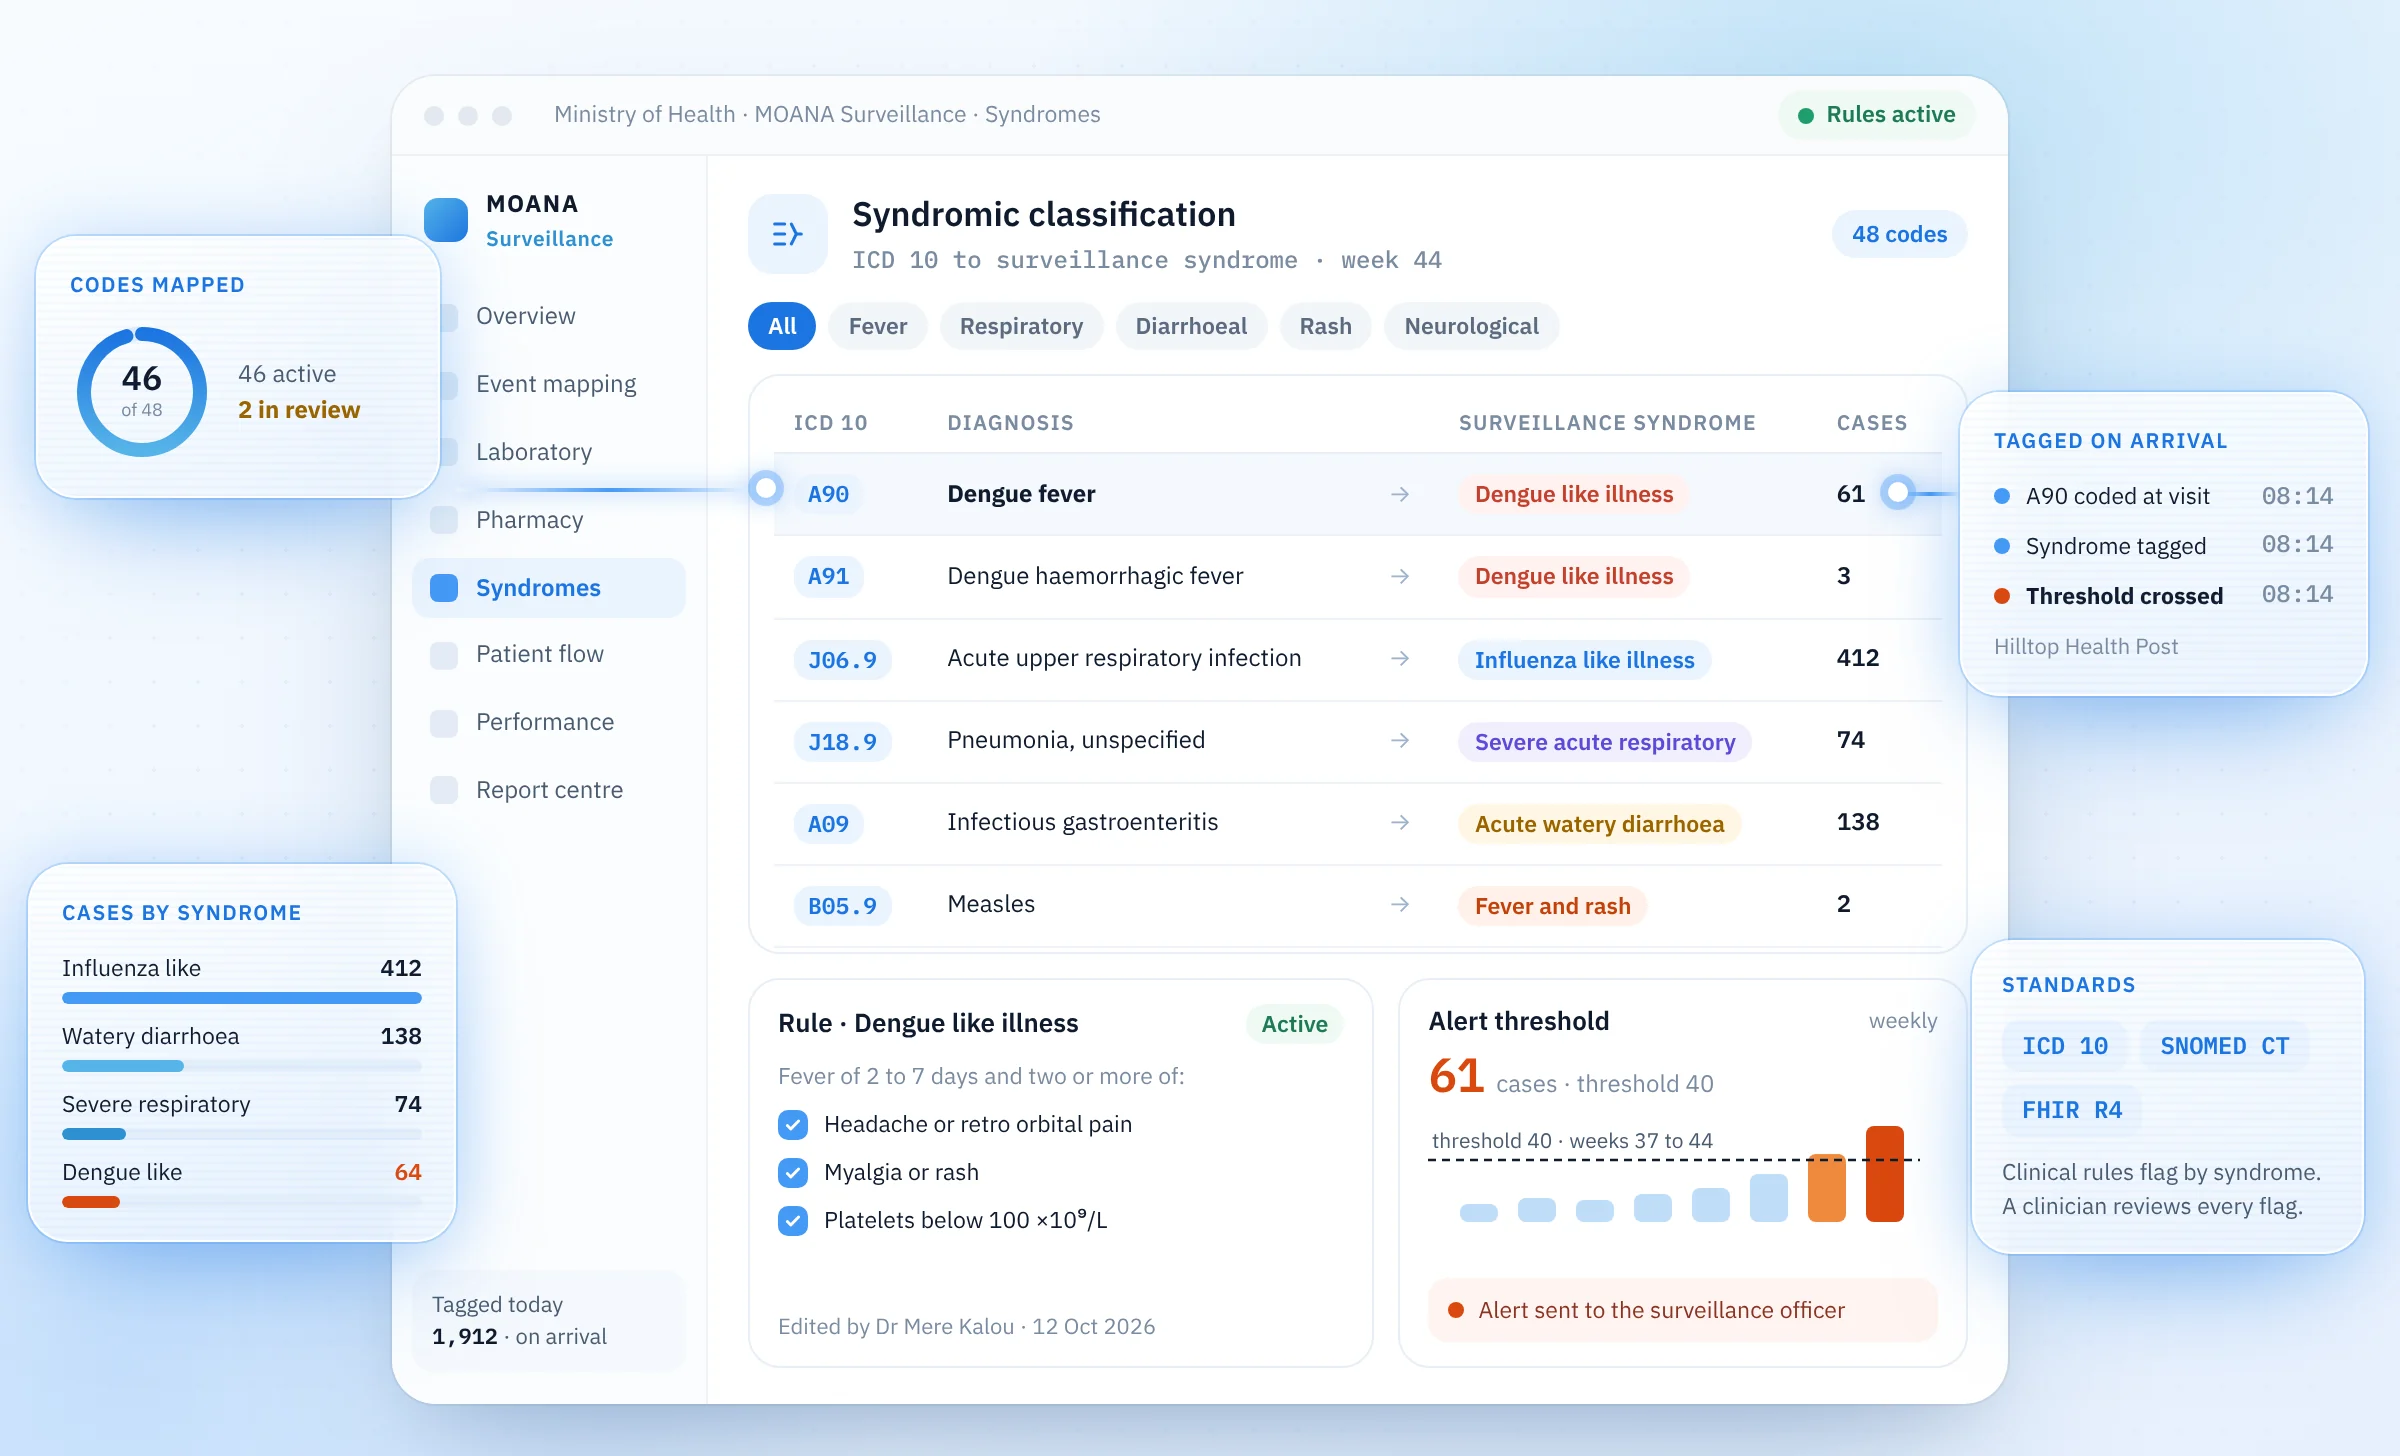
- Classify. Map codes to national syndromes and notifiable conditions using the national case definitions, maintained by the ministry, not hidden in software.
- Deduplicate. Check each event against the master patient index so a patient seen twice is counted once, as covered in master patient index and unique health identifiers.
- Detect. Apply thresholds by syndrome and place, including single case alerts for conditions where one case is a signal, as the Pacific system does [4].
- Route and review. Send alerts to the responsible surveillance officer, who verifies before action.
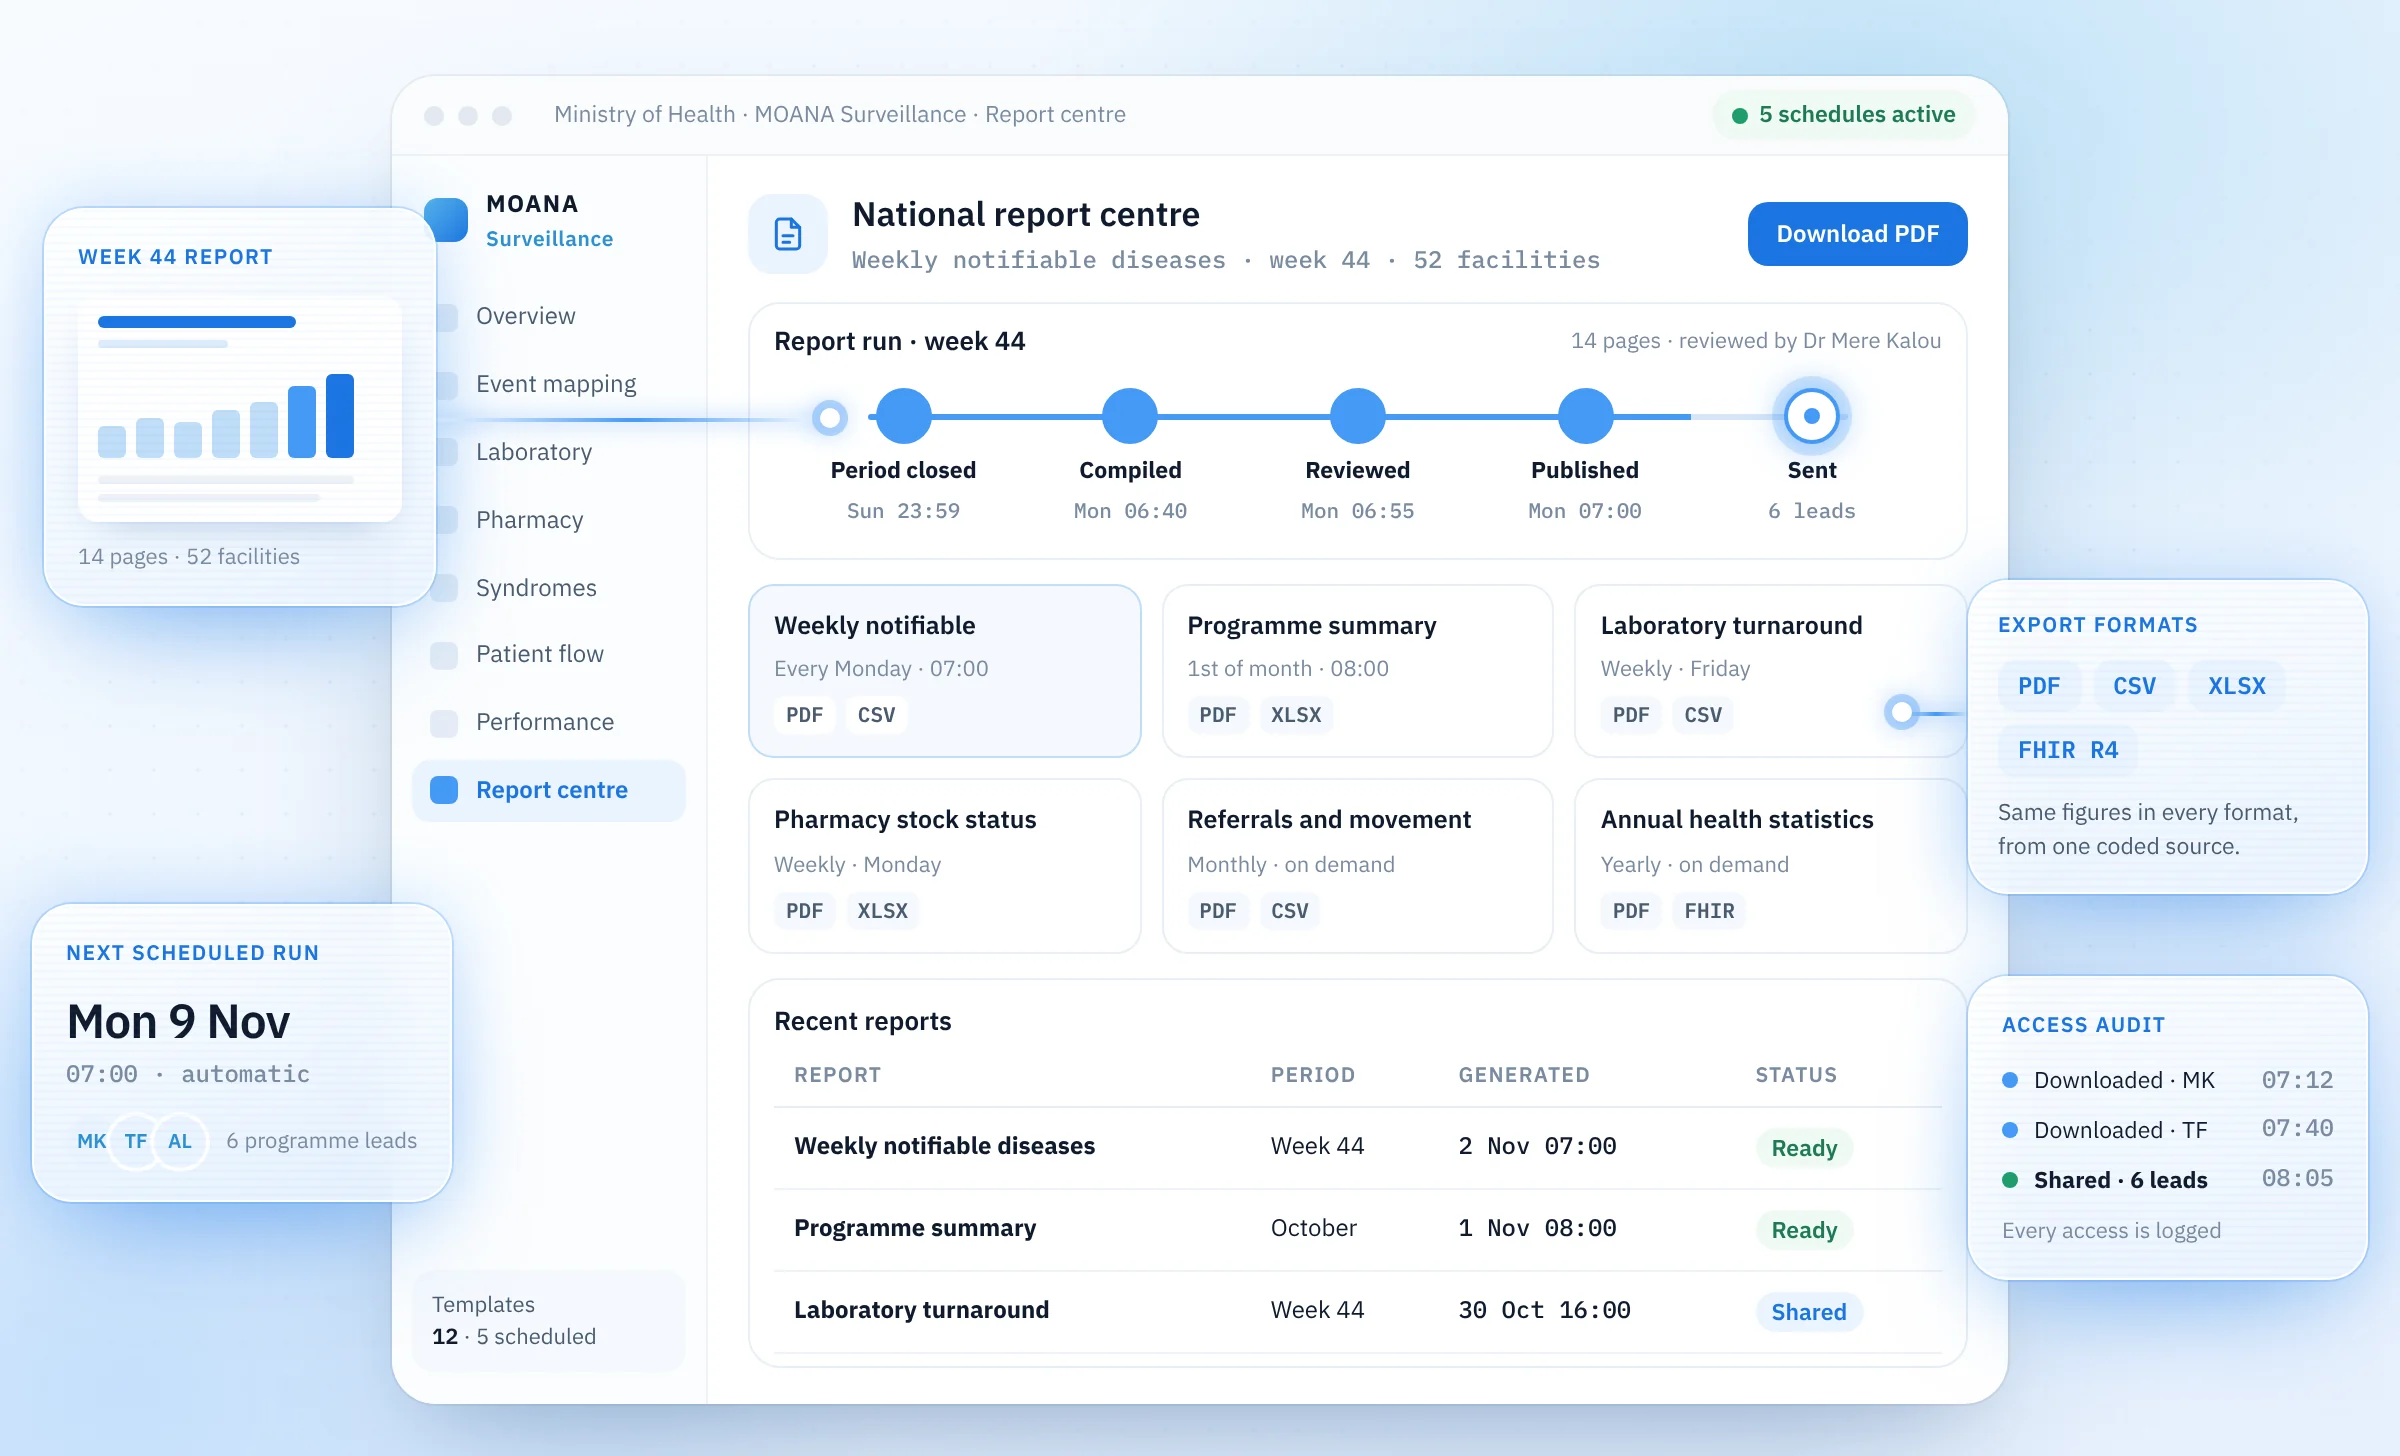
- Report. Produce the weekly IDSR or syndromic return and the aggregate submission to the national HMIS from the same data, as described in traceable national health reporting.
Safeguards
- Surveillance staff, not software, decide what is an outbreak. Automated risk scores and summaries support that judgement.
- Case definitions and thresholds are versioned, so a change in counts can be told apart from a change in rules.
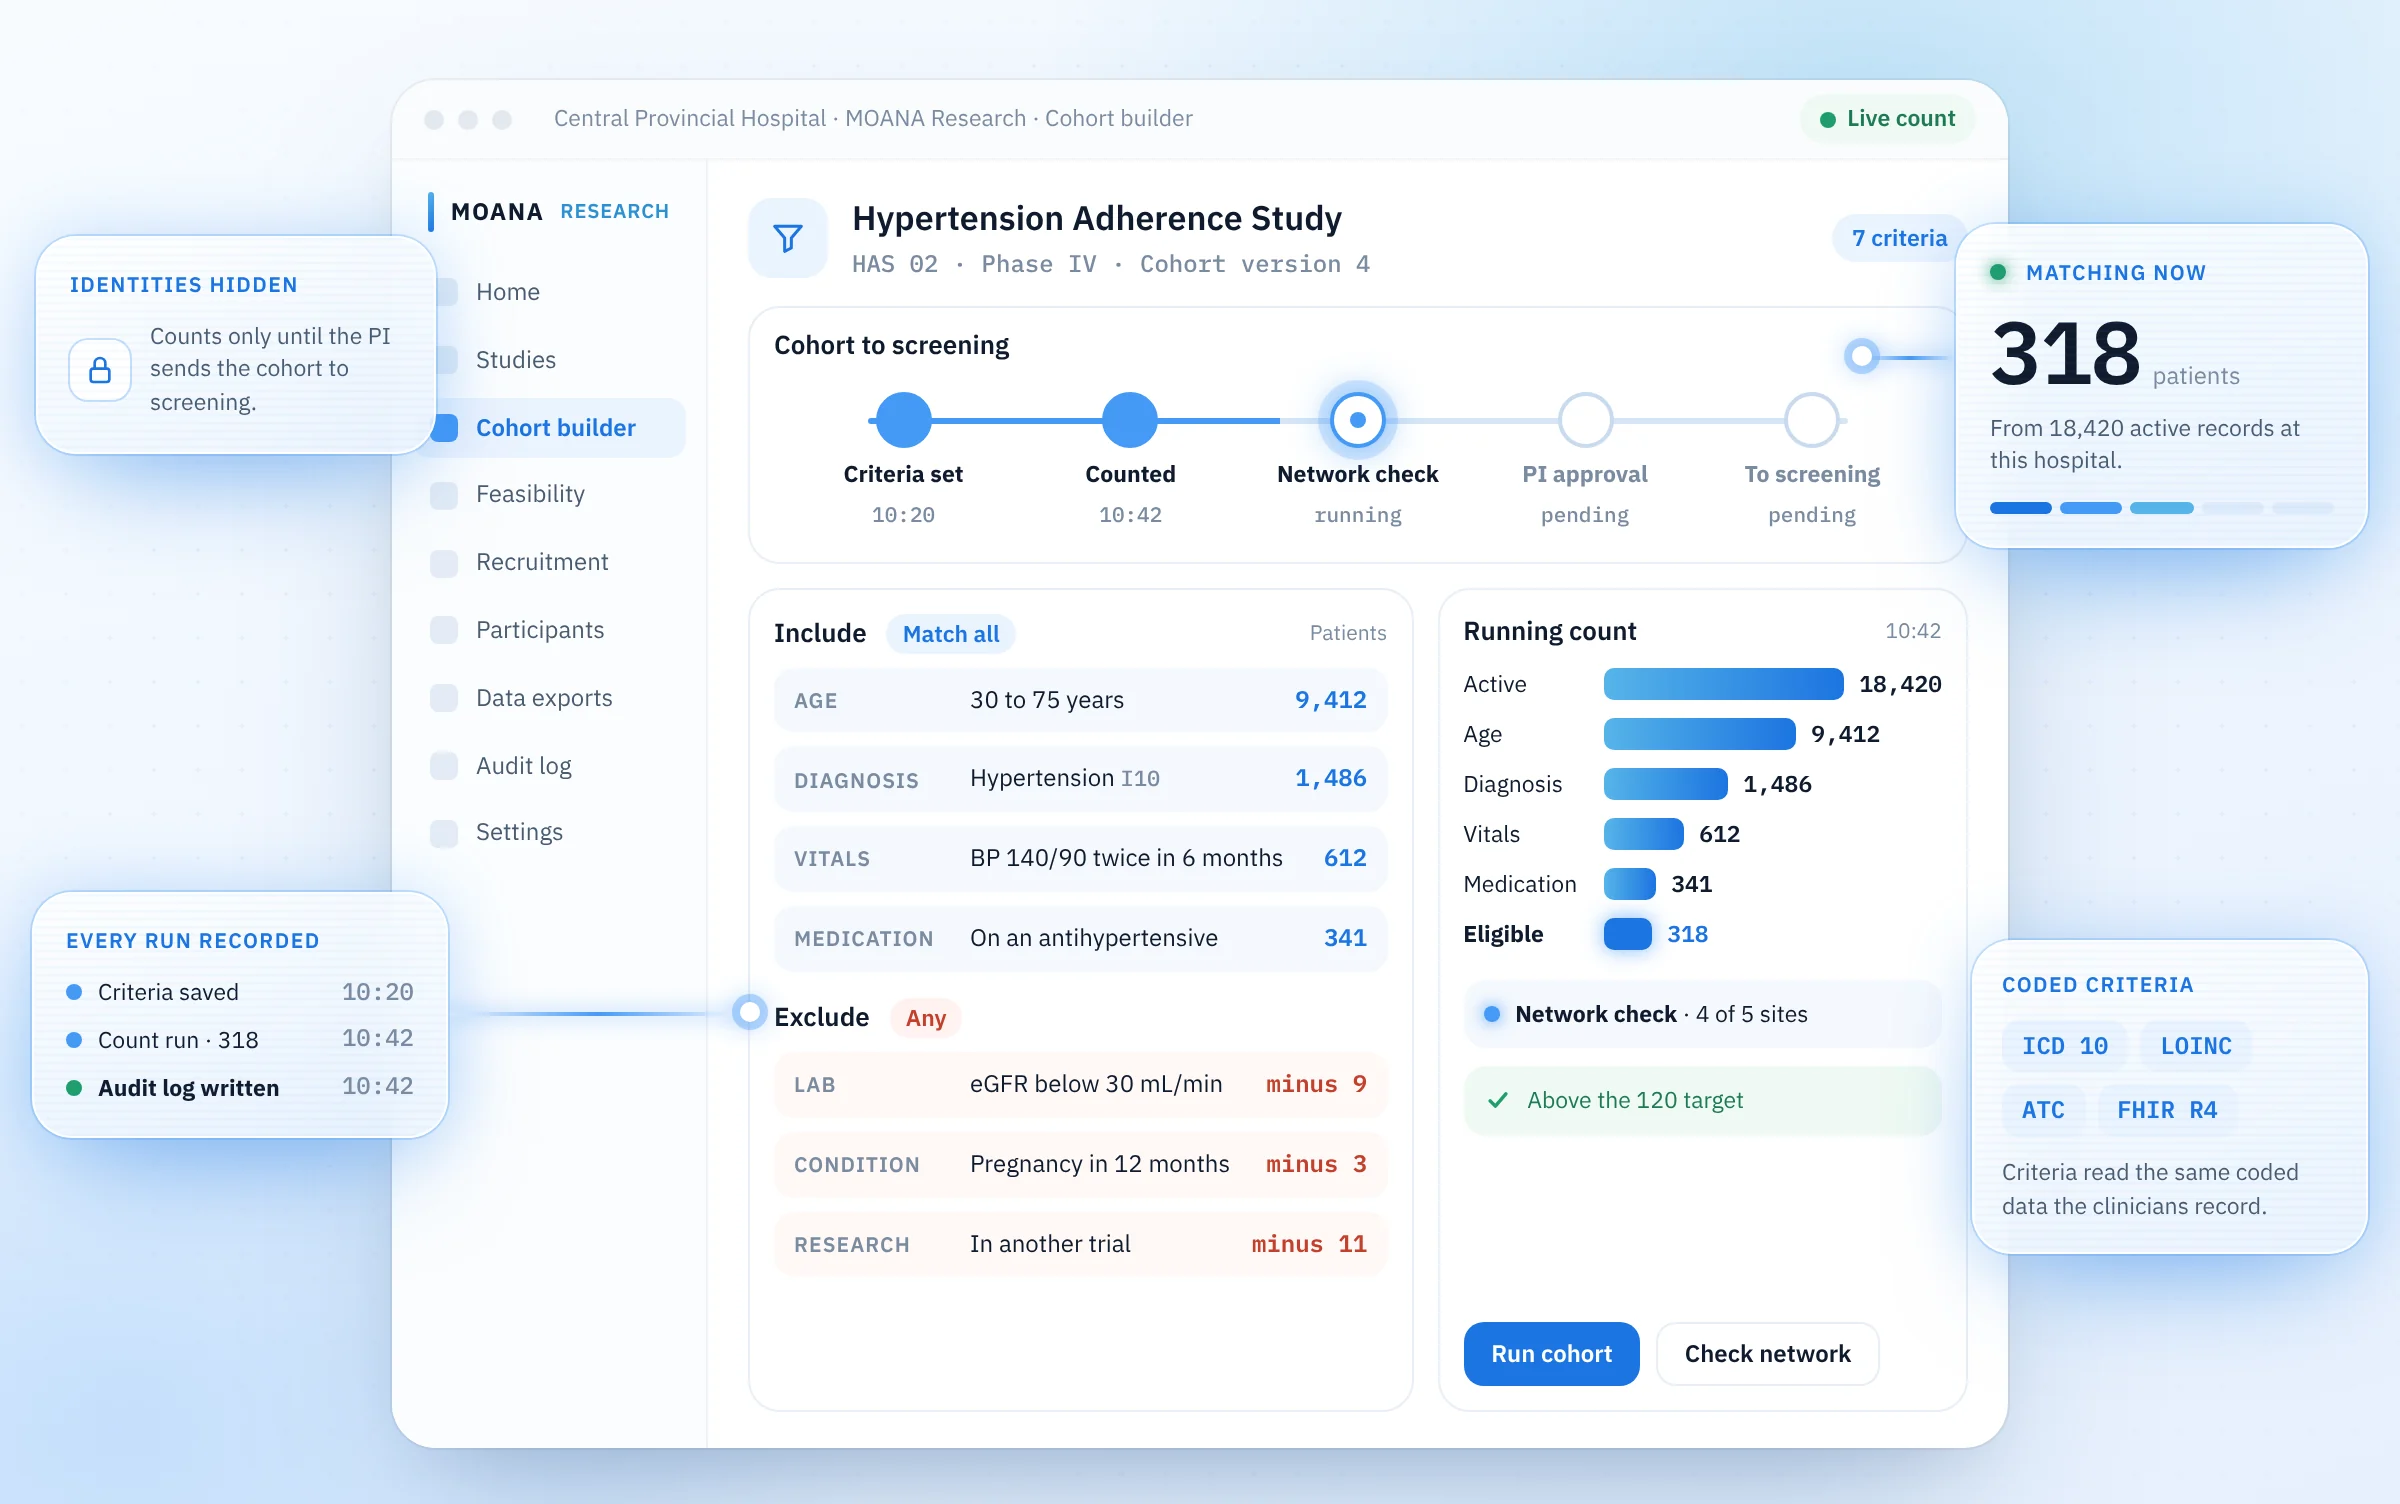
- Access to identified case data is restricted by role and every view is audited, as set out in health data security and privacy.
- Facilities that stop sending data are visible, so silence is not mistaken for absence of disease.
Measuring whether surveillance is working
The indicators that matter can be computed from the system itself:
- Reporting completeness and timeliness by facility and week.
- Data freshness: the time since each facility last synchronised.
- Time from first case to detection, detection to notification, and notification to response, against the 7 1 7 target [6].
- The proportion of alerts verified, and the proportion confirmed by the laboratory.
How Moana approaches surveillance
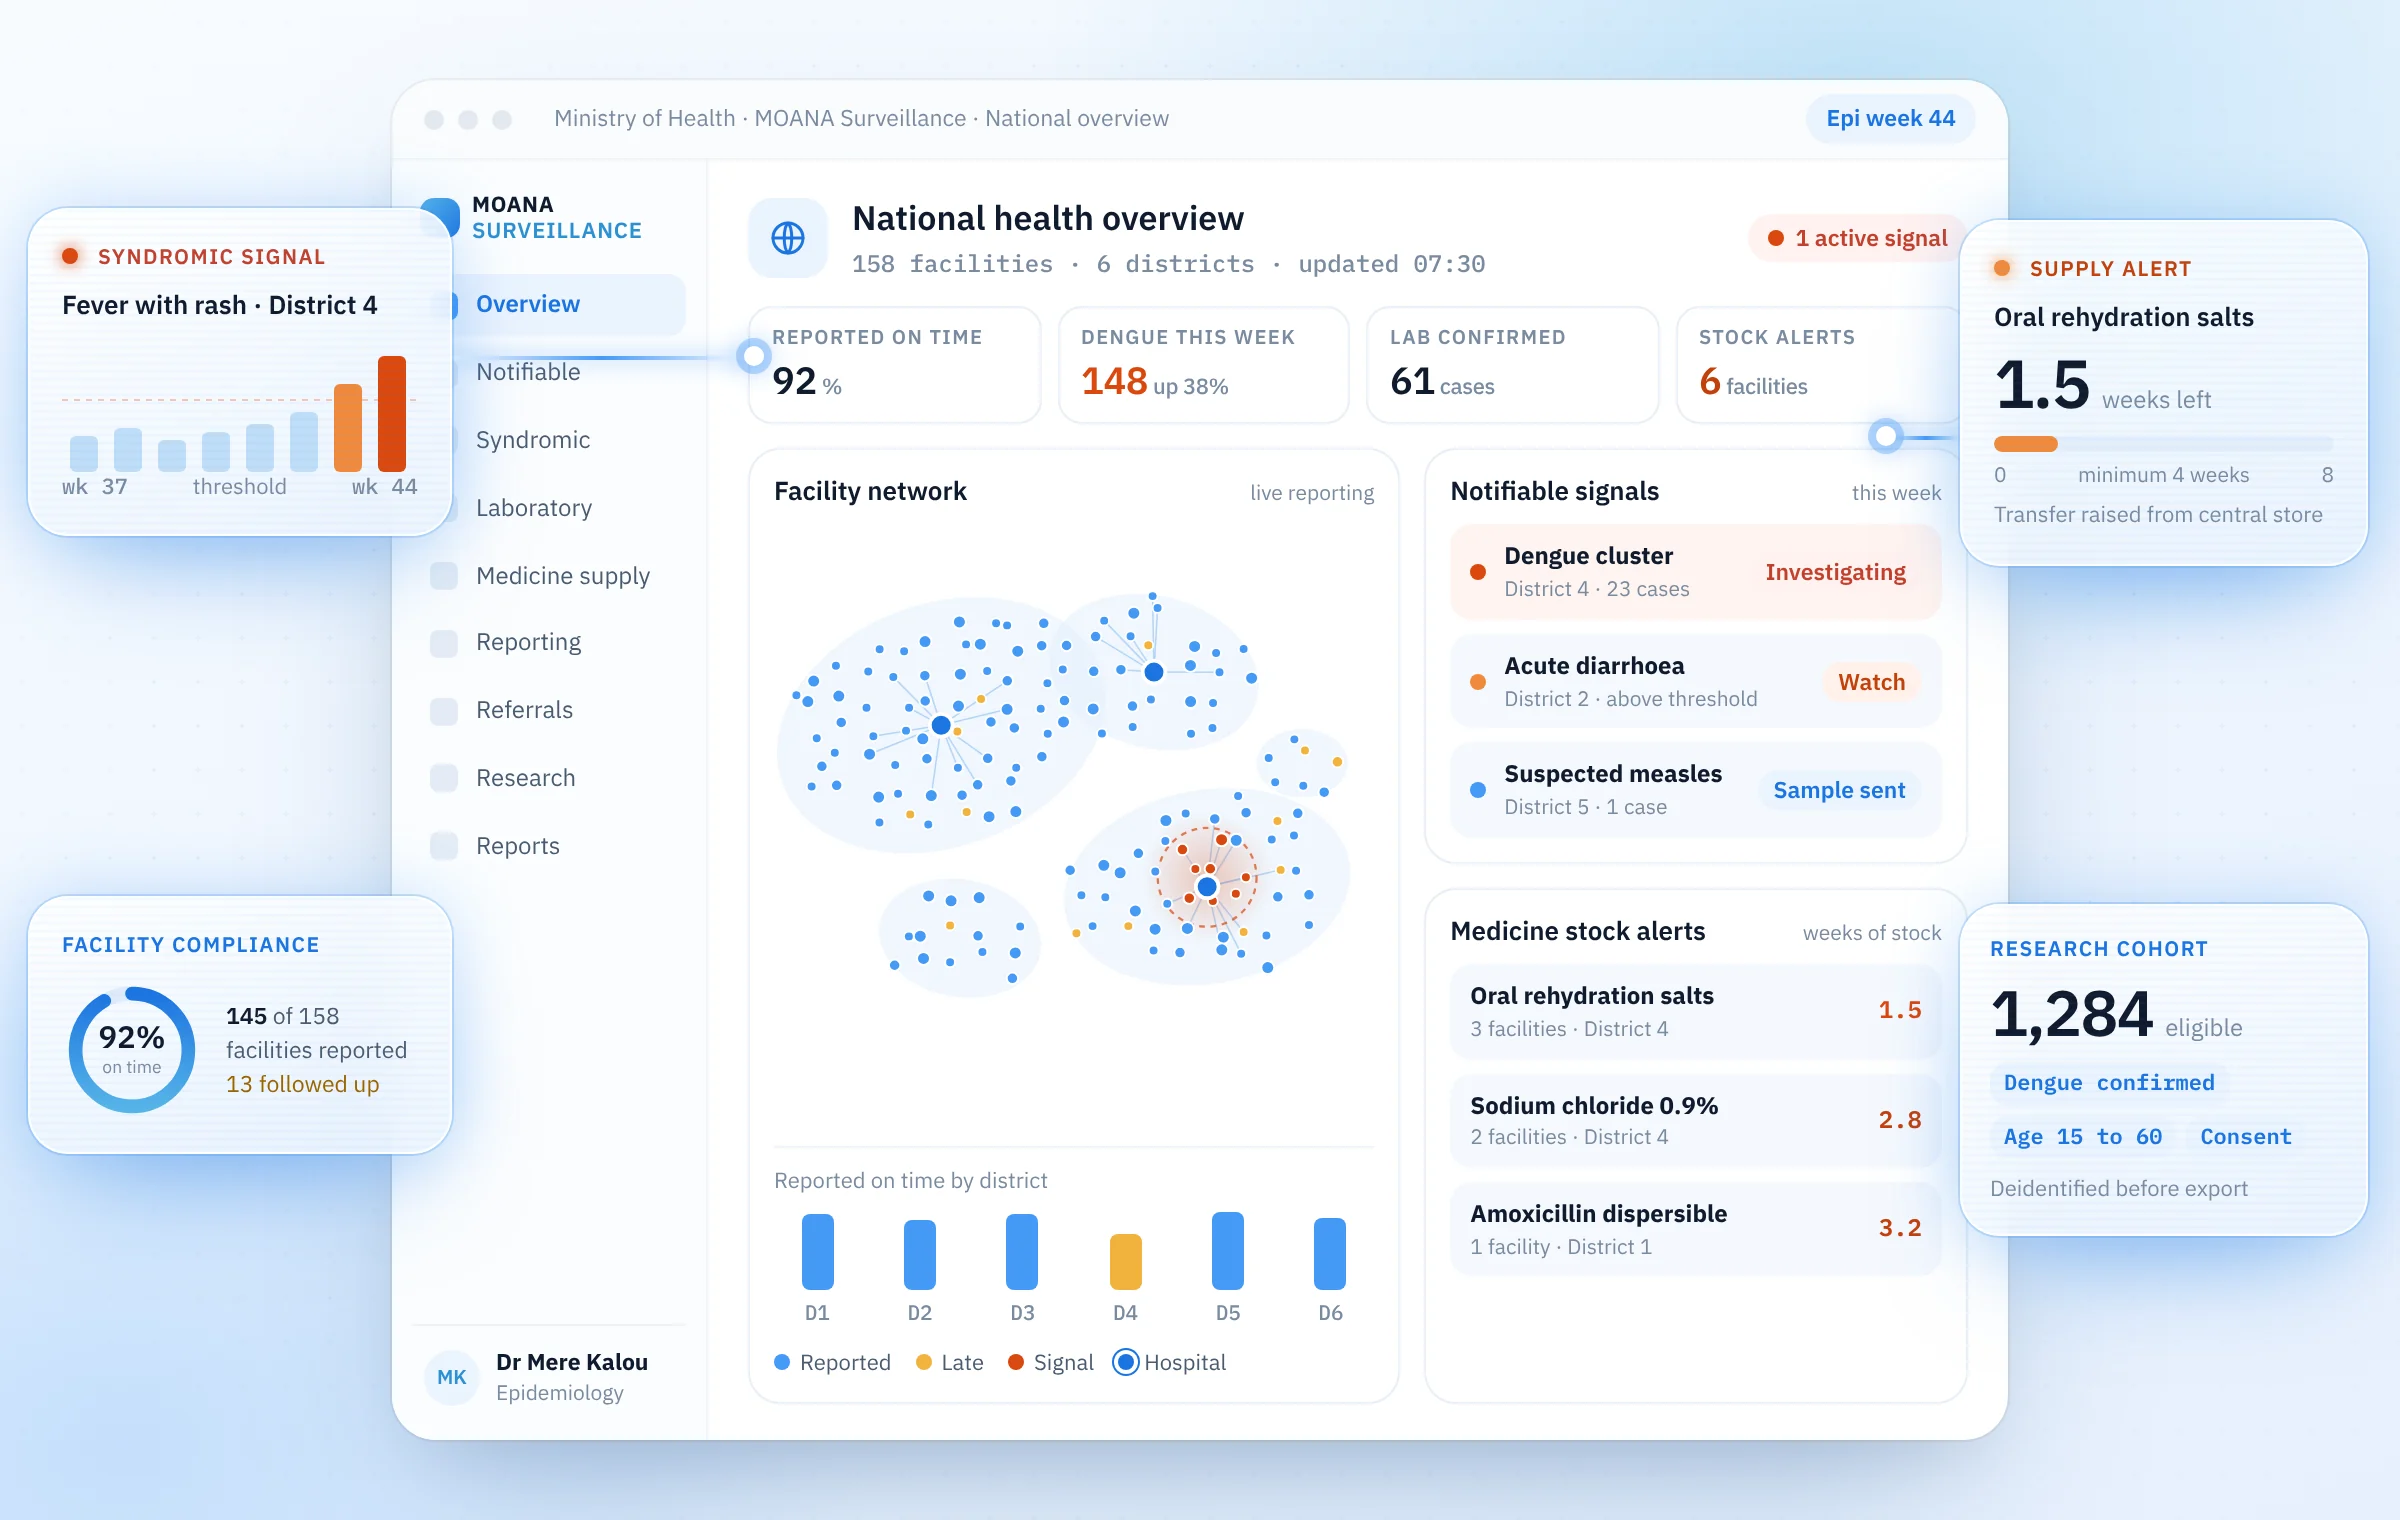
MOANA Surveillance is a standalone national system that reads from routine care recorded in Moana. Coded diagnoses, laboratory results and pharmacy activity flow from facilities as they are recorded.
- Syndromic classification. Diagnosis codes are mapped to surveillance syndromes as they are recorded, not weeks later.
- Notifiable events coded at source. Clinicians record ICD 10 or ICD 11 diagnoses in MOANA EHR as part of the consultation, and MOANA LIS releases coded results with critical value alerts and read back.
- Duplicate matching. Events are checked against the master patient index before they reach national figures.
- Alert rules and thresholds. Rules watch incoming cases and notify the responsible team when thresholds are crossed, with disease mapping down to facility level.
- Laboratory and pharmacy surveillance. Test volumes, positivity, critical results and turnaround are shown alongside stock, expiry and dispensing patterns from the Moana Pharmacy Management System.
- Reporting compliance. National dashboards show which facilities are reporting and how current their data is.
- Reviewed by people. Clinical rules flag patients by severity and an AI generated summary supports the surveillance team; staff review every flag.
- Standards. Aggregates are reported to DHIS2 and exported as FHIR MeasureReport bundles.
Moana is designed for unreliable connectivity: work is saved on the device and synchronised when the connection returns, so a facility on a poor link still contributes its cases. The ministry that collects the data owns it. Moana is live across clinics in Pakistan and clinics in the South Pacific; at ANGAU Memorial Provincial Hospital in Papua New Guinea, every department has been mapped and configured, with go live expected in the coming weeks. See Moana for governments.
Frequently asked questions
Does surveillance from the clinical record replace IDSR?
No. It changes the source of IDSR data from registers and tally sheets to coded records. The weekly IDSR return, the case definitions and the response structure remain the ministry's [3].
How does the record help meet the IHR 24 hour notification requirement?
The 24 hours run from assessment [1]. Automated classification and alerts shorten the time between the first recorded case and the start of assessment.
What is the difference between syndromic and case based surveillance?
Syndromic surveillance counts patients who meet a syndrome definition, such as influenza like illness, to detect unusual increases [4][5]. Case based surveillance keeps a record for each confirmed or suspected case of a specific disease for investigation and follow up.
Can laboratory results trigger notifications automatically?
Yes, when results are coded and mapped to notifiable conditions. Combining laboratory and clinical triggers captures cases that either source alone would miss [8].
What happens when a facility loses connectivity?
Work continues on the device and synchronises when the connection returns. Reporting compliance shows which facilities are behind, so missing data is visible rather than silent.
Sources
- International Health Regulations (2005), full text, World Health Organization (University of Oslo treaty library), 2005
- Annex 2 of the International Health Regulations (2005), World Health Organization, accessed 2026
- Integrated Disease Surveillance and Response Technical Guidelines, Booklet One, third edition, WHO Regional Office for Africa, 2019
- Pacific Syndromic Surveillance System, Pacific Public Health Surveillance Network, accessed 2026
- Early Warning, Alert and Response Network (EWARN), WHO Regional Office for the Eastern Mediterranean, accessed 2026
- The 7 1 7 target, Resolve to Save Lives, accessed 2026
- Syndromic Surveillance at Hospital Emergency Departments, Southeastern Virginia, Morbidity and Mortality Weekly Report, US CDC (Yuan, Love, Wilson), 2004
- Automating Case Reporting of Chlamydia and Gonorrhea to Public Health Authorities in Illinois Clinics, JMIR Public Health and Surveillance (Mishra and colleagues), 2023
- Implementing electronic IDSR at health facilities using mobile Android devices: a case study from Sierra Leone, DHIS2 Annual Conference abstract (Magoba), 2024
- WHO releases new International Classification of Diseases (ICD 11), World Health Organization, 2018
- The burden of recording and reporting health data in primary health care facilities in five low and lower middle income countries, BMC Health Services Research (Siyam and colleagues), 2021